ESCR 2012 / 416
Free-breathing CCTA using 320-detector CT: An initial experience
Congress:
ESCR 2012
Poster Number:
416
Type:
Scientific Exhibit
Keywords:
Artifacts, Technical aspects, CT, Cardiac
Authors:
E.-J. Kang1, K.-N. Lee1, J.-M. Lee2, J. Y. Oh1, B.-H. Park1, H. J. Kwon1, D. H. Ha1, D. W. Kim1; 1Busan/KR, 2Daegu/KR
DOI:
DOI-Link:

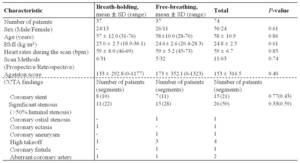
Table 1:
General characteristics and CCTA findings of each patient groups.
, contrast to noise ratio (CNR), and image quality score")
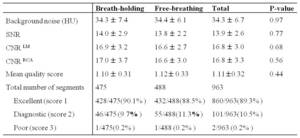
Table 2:
Comparison between the two acquisition methods for image noise, signal to noise...
 protocols.")
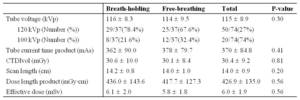
Table 3:
Image scanning parameters, radiation dose estimates in the two groups of...
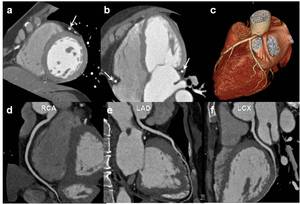
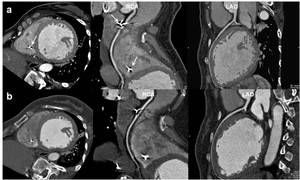
 because of syncope. a–f, Free-breathing prospective CCTA images; short axis multiplanar reconstruction (a), Four-chamber multiplanar reconstructed (b), volume rendered (c), and curved reformatted images (d–f) show the clearly defined coronary arteries (arrows) without a motion artifact.")
Fig. 2:
Fig. 1. A 49-year-old woman who presented for coronary computed tomography...
 twice, before (a–c) and after (d–f) repositioning of a pacemaker. a–c, Breath-holding prospective CCTA images. Short-axis multiplanar reconstructed (a) and curved reformatted images (b, c) show relatively well-defined coronary arteries except the beam hardening artifact at the proximal right coronary artery due to the pacemaker electrode (arrows). d–f, Free-breathing retrospective CCTA performed after 2 months. Short-axis multiplanar reconstructed (d) and curved reformatted images (e, f) clearly show defined coronary arteries. Similar image quality was achieved as with the previous examination except for a wider field of view.")
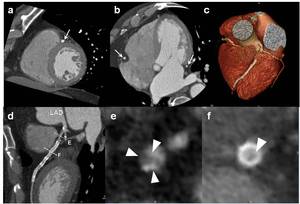
Fig. 3:
A 49-year-old woman had a pacemaker inserted due to a complete atrioventricular...
 images. a, b, Short-axis multiplanar reconstructed (a) and four-chamber multiplanar reconstructed (b) images show relatively well defined coronary arteries (arrows in b) and previously inserted stent (arrow in a). c, Volume rendering images reveal severe luminal narrowing of the just proximal segment of the coronary stent in the left anterior descending artery. Also noted was an irregular lumen in the left circumflex coronary artery. d–f, Curved reformatted images for the left anterior descending artery show narrowing with mixed plaques (arrowheads in e) in the proximal segment and the in-stent partial restenosis (f).")
Fig. 4:
A 69-year-old man with chest pain who underwent a stent insertion procedure in...