ESCR 2015 / P-0028
Influence of upper airways section area on oxygen blood saturation level in patients with obesity and sleep apnea syndrome
Congress:
ESCR 2015
Poster Number:
P-0028
Type:
Scientific Poster
Keywords:
Head and neck, Respiratory system, MR, Comparative studies, Obstruction / Occlusion, Metabolic disorders
Authors:
E. Butorova, D. Ustyuzhanin, M. Shariya, A. litvin; Moscow/RU
DOI:
DOI-Link:
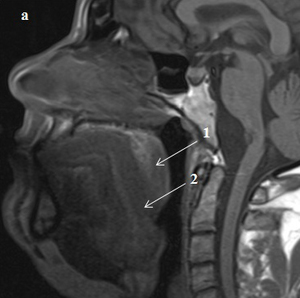
, T1-weighted imaging, obese patient with severe degree of OSA: a - patient with SpO2>75%. 1 - soft palate, 2 - tongue.")
Fig. 1:
Midsagittal magnetic resonance image (MRI), T1-weighted imaging, obese patient...
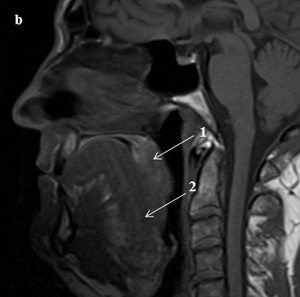
, T1-weighted imaging, obese patient with severe degree of OSA: b - patient with SpO2<75%. 1 - soft palate, 2 - tongue.")
Fig. 2:
Midsagittal magnetic resonance image (MRI), T1-weighted imaging, obese patient...
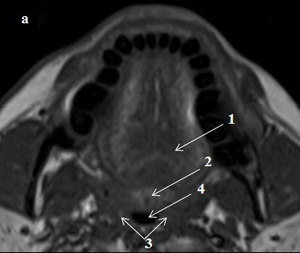
, T1-weighted imaging, obese patient with severe degree of OSA: a - patient with SpO2>75%. 1- soft palate, 2 – tongue, 3 - lateral walls, 4 - area of maximum airway constriction at the level of retropalatal region.")
Fig. 3:
Axial magnetic resonance image (MRI), T1-weighted imaging, obese patient with...
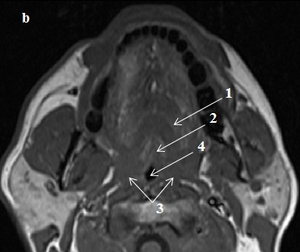
, T1-weighted imaging, obese patient with severe degree of OSA: b - patient with SpO2<75%. 1- soft palate, 2 – tongue, 3 - lateral walls, 4 - area of maximum airway constriction at the level of retropalatal region.")
Fig. 4:
Axial magnetic resonance image (MRI), T1-weighted imaging, obese patient with...