ECR 2013 / C-0959
Efficacy of acoustic shear wave velocity measurement to diagnose metastatic lymph nodes
Congress:
ECR 2013
Poster Number:
C-0959
Type:
Scientific Exhibit
Keywords:
Metastases, Metabolic disorders, Cancer, Imaging sequences, Diagnostic procedure, Computer Applications-Detection, diagnosis, Ultrasound, MR, CT, Paediatric, Neuroradiology brain, Abdomen
Authors:
Y. Tachibana1, R. Kishimoto1, T. Omatsu1, S. Kandatsu2, A. Hasegawa1, M. Koto1, R. Takagi1, T. Obata1, H. Tsuji1; 1Chiba/JP, 2Chiba-Ken/JP
DOI:
10.1594/ecr2013/C-0959

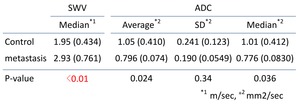
Table 1:
Comparison between control and metastasis groups.
Data indicate the average of...
 and the average of apparent diffusion coefficient (ADC).")
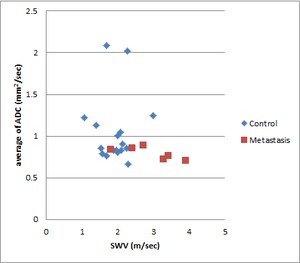
Fig. 3:
Scatter plot of shear wave velocity (SWV) and the average of apparent diffusion...

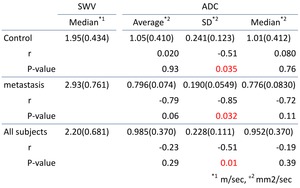
Table 2:
Correlations between SWV and ADC parameters.
Data indicate the average of the...
 and the standard deviation (SD) of apparent diffusion coefficient (ADC).")
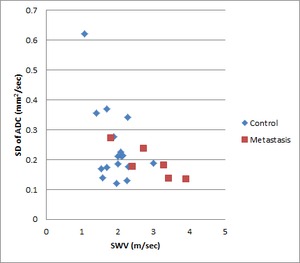
Fig. 4:
Scatter plot of shear wave velocity (SWV) and the standard deviation (SD) of...