ECR 2013 / C-0968
Application of the PI-RADS score system by radiologists in training on the multiparametric MRI studies performed to patients under biochemical suspicion of prostatic cancer and previous negative biopsies before a new targeted biopsy.
Congress:
ECR 2013
Poster Number:
C-0968
Type:
Scientific Exhibit
Keywords:
Genital / Reproductive system male, Pelvis, MR, MR-Diffusion/Perfusion, MR-Spectroscopy, Observer performance, Outcomes analysis, Structured reporting, Cancer
Authors:
D. Gutierrez, O. Chirife, C. Pineda; Barcelona/ES
DOI:
10.1594/ecr2013/C-0968
. This lesion was classified as PI-RADS 5 by both readers. B and C. DWI (high b value) and corresponding ADC map, showing a focal area of hyper SI with reduced ADC (arrows). Classified as PI-RADS 5 by both readers. D and E. DCE sequence and selected still image depicting a type 3 curve of the focal lesion. Classified as PI-RADS 4 by both readers. F. Qualitative spectroscopy. The creatine peak is higher than the Citrate peak. This finding was classified as PI-RADS 4 by one of the readers and 3 by the other. In this case the biopsy of the suspicious area was positive for carcinoma, Gleason 3+4")
Fig. 1:
A.T2w image depicting a low signal intensity focus with bulging of the capsule,...
. This finding was classified as PI-RADS 2 by both readers. B and C. DWI (high b value) and corresponding ADC map. Classified as PI-RADS 2 by one of the readers and 4 by the other. D. DCE sequence of the area identified in the T2w image (continuous line). Classified as PI-RADS 2 by both readers. E. Qualitative spectroscopy. The citrate peak is more than two times de high of the creatine peak. This finding was classified as PI-RADS 1 by both readers. The biopsy of the suspicious area was positive for carcinoma. Gleason 3+3.")
Fig. 2:
A. T2w image depicting an area of homogeneous low SI, well marginated,...

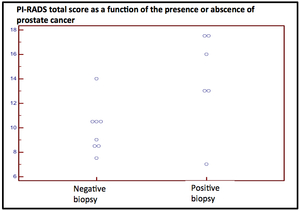
Fig. 3:
Pooled data

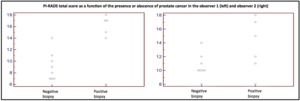
Fig. 4:
Independent data