This poster is published under an
open license. Please read the
disclaimer for further details.
Keywords:
Colon, Computer applications, eHealth, CT, RIS, PACS, Computer Applications-Virtual imaging, Structured reporting, Outcomes analysis, Cancer, Education and training, Outcomes
Authors:
D. J. Vining1, T. Yang1, U. I. S. E. N. Salem1, C. Popovici2, A. Pitici2, A. Prisacariu2, M. Jurca2; 1Houston, TX/US, 2Chapel Hill, NC/US
DOI:
10.1594/ecr2014/B-0974
Methods and materials
We developed a multimedia structured reporting system,
called ViSion,
which operates in parallel with any vendor’s CTC image processing and display software running on a computer workstation using a Microsoft operating system (1).
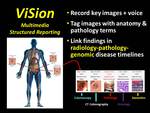
ViSion comprises a client-server software system that enables a radiologist to capture key images from a CTC imaging system and tag those images with metadata describing the anatomical location and radiological observation/diagnosis of the finding (Figure 2).
As a radiologist identifies image findings in a CTC exam,
the radiologist presses a button on a keyboard or speech microphone to initiate a screen capture of the finding which is uploaded to the ViSion server and stored in a SQL database.
As the radiologist dictates a verbal description of the finding,
that voice description is also uploaded and associated with the finding (Figure 3).
Metadata describing the finding’s anatomical location,
radiological observation/diagnosis,
and secondary characteristics (e.g.,
polyp shape,
C-RADS designation) can be extracted from the voice description using natural language processing techniques or manually assigned by the radiologist using drop-down menus (Figure 4).
This metadata is managed by an integrated ontology authoring tool,
and currently the ViSion ontology contains 921 anatomical locations and 12,056 observations/diagnoses.
Additional supporting images can be captured and assigned to specific image findings (Figure 5).
ViSion maintains a comprehensive audit trail of modifications that may be made to an image finding (Figure 6).
Recommendations for further evaluation (e.g.,
colonoscopy or surgical consult) can be made and tracked in the system (Figure 7).
Multiparametric disease metrics (e.g.,
diameters,
volume,
Hounsfield Units) can also be recorded for each image finding (Figure 8).
The C-RADS characterization scheme was modeled after BI-RADS for mammography in order to effectively communicate the significance of CTC and extracolonic findings (Figure 9) (2).
ViSion incorporates the C-RADS scheme as a secondary characteristic to categorize colonic findings,
but we also apply a 5-point medical priority scale (maintained in the ViSion ontology) for characterizing every extracolonic finding in a ViSion report from Incidental (i.e.,
can be ignored) to life-threatening (requires immediate attention) (Figure 10).
The medical priorities can be modified before a radiologist signs a ViSion report.
When a radiologist signs a ViSion report containing Urgent or Life-Threatening findings,
automatic notification of critical results can be triggered.
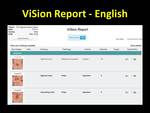
The ViSion ontology also provides for automatic translation of reports to multiple languages so that a report generated in English (Figure 11) can also be delivered in Chinese (Figure 12),
Arabic (Figure 13) or multiple other languages.
As illustrated in Figure 2,
ViSion supports a means to link radiological findings to endoscopy results,
pathology reports,
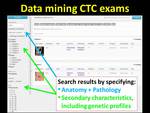
and even genetic information in graphical disease timelines that can enable data mining and outcomes analyses (Figure 14).


