A total of 20247 digital mammograms of 5076 patients (standard mammography consists of two projection images per breast,
i.e.
4 images per patient) were acquired by six mammography units,
using the standard automatic exposure mode (AEC).
In Table 1 ,
the total number of patients and images are given per mammography equipment used.
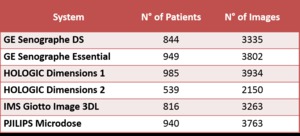
Table 1: Brand and model of the digital mammography systems used, number of patients and images collected per each.
All the images (raw data) were processed by Volpara 1.5.0 (Volpara,
Matakina Ltd,
NZ) and volumetric breast density (VBD),
i.e.
the relative fraction of glandular tissue over the full breast volume,
was calculated.
MGD = Ki x g x c x s
where
- Ki is the incident air kerma at the upper surface of the breast,
measured without backscatter [9];
- g is the incident-air-kerma-to-MGD conversion factor for a 50% breast “glandularity” and an x-ray spectrum produced by a mammography system with molybdenum/molybdenum (Mo/Mo) anode/filter combination;
- c is a factor correcting from breast “glandularity” different from 50%;
- s is a factor correcting for spectra others than Mo/Mo.
Conversion factors (g,
c,
and s) are published for different anode/filter combinations,
HVL values and breast thickness in the range 20-110 mm.
Any other value can be determined by interpolation from published tables.
Fraction of entrance dose absorbed by the breast increases while the photon energy (x-ray spectrum HVL) increases,
and,
for a given spectrum,
decreases while breast thickness increases.
Regarding differences among breast density,
compared to the “fifty-fifty” case considered the standard for dosimetry,
there is an increase of the fraction of absorbed dose up to 30% for breast glandularity below 50%,
and a decrease down to 20% for breast glandularity below 50%.
In Fig. 1,
g-factors for different HVLs and c-factors for different breast glandularity values are shown as a function of compressed breast thickness.
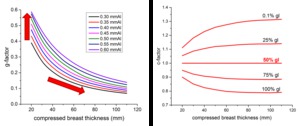
Fig. 1: Left: g-factors versus compressed breast density for different HVL values. The g-value increases as x-ray energy increases, and decreases as breast thickness increases; Right: c-factors versus compressed breast density for different breast glandularities. The compositional factor is equal to 1 for 50% glandularity, while is greater than 1 for glandularity below 50% (increase in the dose absorption rate), and lower than 1 for glandularity above 50% (decrease in the dose absorption rate).
A quick remark to remember that breast “glandularity” is slightly different than volumetric breast density,
and has to deal with the breast model used in the Monte Carlo which produced the conversion factors [1].
In fact,
breast was modelled by a semicircular volume made by a uniform mixture composed by a fraction of glandular tissue and the complementary fraction of fat,
and a few millimeter shell of adipose tissue representing skin and subcutaneous fat (Fig. 2).
Compositional factors (c-factors) in the Dance model were obtained considering variations in the internal breast volume,
while keeping the external shell unchanged.
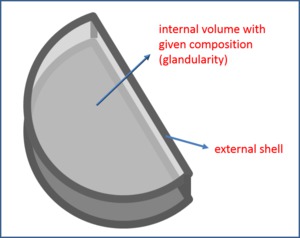
Fig. 2: Figure 2: Breast model used in the Dance model to derive dose conversion factors. Breast is represented by an internal volume, whose composition can change between 0% and 100% glandularity, circumscribed by an external shell (skin and subcutaneous fat) which is kept unchanged in the Monte Carlo. For this reason, breast glandularity does not coincide perfectly with breast density.
In this study,
the Volpara software was used to calculate volumetric breast density from each image and subsequently determine breast glandularity,
according to Dance model; glandularity was used to calculate a more accurate c-factor and “adjust” the estimated mean glandular dose compared to the 50/50 assumption.
This was done overall and separately for each mammography unit.
Distributions of MGD adjusted for breast density by different systems were compared with those obtained from MGD values provided by each manufacturer and stored in the DICOM image header.
A Wilcoxon test for paired samples was applied.
A p-value < 0.05 was considered statistically significant.


, and lower than 1 for glandularity above 50% (decrease in the dose absorption rate).")
 which is kept unchanged in the Monte Carlo. For this reason, breast glandularity does not coincide perfectly with breast density.")