The measurement of flow in a cerebral aneurysm and the feeding artery using the combination of high-speed DSA and dedicated post-processing software depends on several steps that have to be performed appropriately.
General
The calculation of the flow information requires a 3D rotational angiography (3DRA) and a dedicated high frame-rate (60 frames per second) DSA run.
During the DSA run contrast medium is injected at a very modest pace.
The contrast medium intensity becomes modulated by the cardiac cycle.
As a result,
there is more blood and consequently less contrast agent in the mix of both during the systole phase,
leading to less X-ray absorption than during the diastole phase.
This pattern travels through the vessels and aneurysm,
and can be followed in the high frame-rate DSA by an appropriate algorithm [1].
Note that flow measurement is not possible on coiled aneurysms,
because the coils absorb too much x-ray.
The 3DRA is consequently used to correct for foreshortening in the feeding parent vessel,
and provides the vessel diameter information used in the arterial flow calculations.
It should be noted that the most reliable results are obtained for larger (diameter > 5 mm) saccular aneurysms.
3DRA acquisition
The flow measurements require a 3D rotational angiography (3DRA) of the aneurysm and feeding artery.
Only one 3DRA acquisition is needed,
and the same 3DRA dataset can be used for the flow measurements prior to stent deployment and the ones after stent deployment.
If a 3DRA is routinely acquired for treatment planning,
measurement of the aneurysm dimensions and sizing of the stent,
this 3DRA data can be used in calculation of the arterial flow.
It is essential,
however,
that a sufficiently large part of the feeding artery proximal to the aneurysm is contained within the 3DRA dataset (Figure 1).
At least 20 mm is required,
but since foreshortened and highly curved parts will not be used in the measurements,
it is advisable to select the field of view such that ample length of the feeding artery is available.
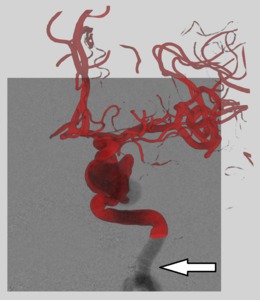
Fig. 1: Example of a 3DRA (red) overlaid on the flow DSA run, with part of the parent artery missing from the 3DRA field of view (arrow). This limits the arterial flow measurement to the distal part of the parent artery.
References: NEURI center, Beaujon University Hospital, Paris, France
Selection of the C-arm viewing incidence
It is essential that the C-arm viewing angles are selected appropriately.
Therefore,
it is best to use the 3DRA to plan an optimal view on the aneurysm beforehand.
The following aspects need to be taken into account (Figure 2):
- A good view on the aneurysm neck,
allowing to clearly distinguish and separate the aneurysm sac from the feeding artery
- No or minimal overlap of the aneurysm sac and the vessel tree
- Preferable a separation between the aneurysm and the adjacent not connected parts of the vessel tree
- A sufficiently large part of the feeding vessel should be visible with minimal foreshortening and overlap with other vasculature
The automatic C-arm positioning (APC) can be used to steer the C-arm to the selected 3DRA angle.
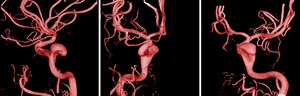
Fig. 2: Left: a good viewing angle on the aneurysm, as the neck is clearly defined, there are arterial segments with minimal foreshortening, and the aneurysm is clearly separated from the vessel tree. Middle and right: poor viewing angles, as the aneurysm neck is not well defined in this view, and there is overlap of the aneurysm and the arteries.
References: NEURI center, Beaujon University Hospital, Paris, France
Field of view for the flow DSA
The field of view of the DSA should be selected such that the aneurysm is visible with sufficient spatial detail,
while assuring that at least 20 mm of usable arterial segment is available.
A field of view of 15 cm to 22 cm gives the best results in our experience.
It is advisable to position the field of view such that the aneurysm is in the upper part of the image (above the center),
and the feeding vessel in the lower part (Figure 3).
Motivation: this provides the maximal feeding vessel length,
and shows less of the distal vessel tree,
which is of lesser importance for the flow measurement.
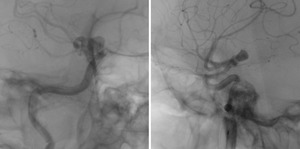
Fig. 3: Examples of well-positioned flow runs; the aneurysm is located within the upper part of the field of view, and there is sufficient arterial vessel without (substantial) foreshortening available.
References: NEURI center, Beaujon University Hospital, Paris, France
Catheter location and injection protocol
In order to achieve sufficient mixing of the contrast medium and blood,
there needs to be a sufficient distance between the guiding catheter tip and the measuring area in the feeding artery.
It is therefore advised to position the catheter just outside the flow DSA field of view.
This implies that after stent deployment,
the catheter has to be pulled back to the proximal part of the parent vessel in order to meet this requirement.
To get the best mixing of contrast and blood,
the position of the catheter should be placed a bit lower in the internal carotid artery at the C3 vertebral level,
depending on the aneurysm location.
In some particular cases with high carotid bifurcation,
the catheter is inevitably placed at the C2 level for its stability.
The flow measurements rely on the contrast medium being modulated by the pulsatile cardiac modulation of the blood flow.
The non-diluted contrast medium is therefore injected at a very moderate pace.
It is advised to set the injection rate to 1.5 ml/second,
and to use 6 ml of undiluted contrast in total (injection of 4 seconds duration).
Automated injector coupling is recommended to ensure a constant injection rate.
X-ray or injector delay should be absent (no delay),
as the natural delay has been proven to be always sufficient to see the contrast wash-in within the field of view.
Flow DSA run acquisition
The acquired runs should contain at least four cardiac cycles.
The maximal duration of the flow DSA runs is set to 7.5 seconds,
which means that if the pedal is kept pressed,
the run will end automatically after 7.5 seconds.
It is recommended to acquire either the full 7.5 seconds or stop when the contrast medium has completely disappeared from the region of interest,
ensuring that an adequate amount of cardiac cycles are contained within the flow run.
If the patient is not sedated,
instruct them not to move during the acquisition run.
Processing steps: arterial segment
When the flow run has been acquired,
it will automatically be opened in the AneurysmFlow software (Philips,
Best,
The Netherlands).
The most recent 3DRA run will be automatically matched to the DSA run,
and the proximal arterial segment will be selected automatically.
The arterial segment selection can be adjusted automatically.
The parts that can be used for arterial flow measurements are indicated in green,
while the parts that cannot be used (because of foreshortening,
overlap or curvature) are marked orange (Figure 4).
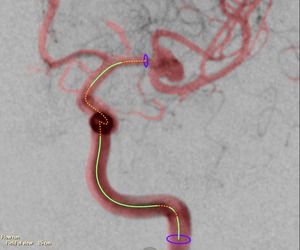
Fig. 4: The arterial segments used for the arterial flow measurements are marked in green. The orange parts are excluded (e.g., due to foreshortening or curvature).
References: NEURI center, Beaujon University Hospital, Paris, France
The length of the green marked segment used for measurements (‘usable length’) and maximal arterial flow are indicated on screen,
along with icons that indicate whether they are deemed sufficient (Figure 5).
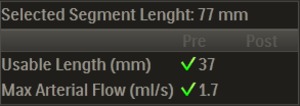
Fig. 5: Arterial segment length and arterial flow measurement.
The arterial flow graph can be opened and inspected to verify the contrast density signal within the selected arterial segment.
It should be possible to recognize the cardiac cycle within the graph (Figure 6).
When this is not the case,
the flow run is not usable,
and a new acquisition might be necessary.
In that case it is advisable to check whether the injection protocol (1.5 ml/second,
4 seconds duration,
6 ml undiluted contrast agent) is properly programmed,
and whether the injector and catheter are not malfunctioning.
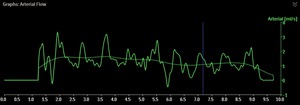
Fig. 6: Arterial flow as function of time. The solid line clearly shows the cardiac pulsation, while the dotted line represents the running average.
References: NEURI center, Beaujon University Hospital, Paris, France
Processing steps: select region of interest
In the second processing step,
a region of interest has to be selected on which the flow vector field is computed.
The complete aneurysm should be contained within this region,
as well as a part of the parent artery (Figure 7).
It should be noted that the computation time increases for larger regions.
Within the region of interest the parts that filled with contrast medium are automatically highlighted.
The threshold used to find the contrast can be adjusted by the user.
Furthermore,
there are paint and eraser tools to add and/or remove parts.
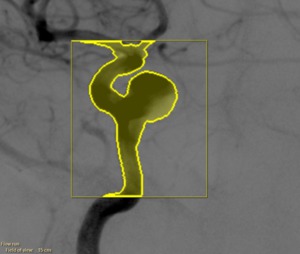
Fig. 7: Selected region of interest
References: NEURI center, Beaujon University Hospital, Paris, France
Processing steps: review
In the review step,
the contrast wave,
the flow amplitudes and flow vectors are calculated and automatically visualized once the calculations are finished.
The contrast wave shows the contrast intensity progression that is introduced by the cardiac pulsation (Figure 8).
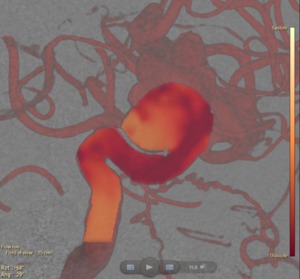
Fig. 8: The contrast wave travelling through the artery and aneurysm for a given time point is overlaid on the 3DRA and DSA data. Yellow/orange indicates the systole phase and red the diastole phase.
References: NEURI center, Beaujon University Hospital, Paris, France
The blood flow velocity magnitudes and vectors can be visualized per frame or averaged over time (Figure 9).
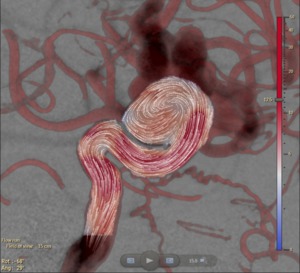
Fig. 9: The average flow vector field within the region of interest.
References: NEURI center, Beaujon University Hospital, Paris, France
Acquiring pre- and post-deployment flow measurements
Ensure that the patient is positioned the same in both pre- and post-deployment runs.
When acquiring the post-deployment run,
this can be easily achieved by opening the pre-deployment run and using the automatic C-arm positioning (APC) to steer the C-arm to the same viewing incidence angles.
Retract the catheter just outside the field of view and use the same injection protocol (1.5 ml/second,
4 seconds duration,
6 ml undiluted contrast agent).
Make sure no other material (guidewire,
delivering catheter,
etc) is left in the field of view.
The post-deployment flow run will automatically open in the right-hand side of the screen,
while the pre-deployment flow run will reside on the left-hand side of the screen (provided that the same C-arm incidence angles are used,
as described above).
The same processing steps as for the pre-deployment flow runs have to be performed on the post-deployment run.
The resulting flow vector fields are then shown for both runs (Figure 10).
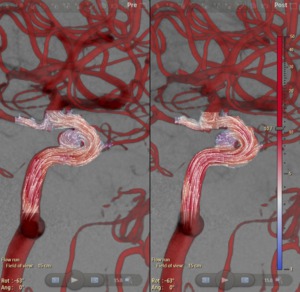
Fig. 10: Left: pre-deployment flow vector field. Right: post-deployment flow vector field.
References: NEURI center, Beaujon University Hospital, Paris, France
The mean aneurysm flow amplitude (MAFA) ratio
Once all processing steps have been performed for both flow runs,
the mean aneurysm flow amplitude (MAFA) ratio between the pre- and post-deployment runs can be calculated.
This is done by manually defining an outline around the aneurysm (Figure 11).
Within this curve the aneurysm flow will be calculated.
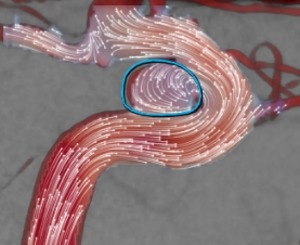
Fig. 11: A measurement outline is created around the aneurysm.
References: NEURI center, Beaujon University Hospital, Paris, France
The MAFA-ratio is defined as the ratio between the mean aneurysm flow prior and after stent deployment,
normalized by the arterial flow:
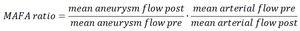
Table 1
The MAFA measurements and their ratio are automatically calculated in the software (Figure 12).
It should be noted that the MAFA-ratio requires both the aneurysm flow and the arterial flow.
In case the arterial flow could not be established (e.g.,
because the algorithm could reliably distinguish a sufficiently modulated signal),
the MAFA-ratio cannot be calculated.
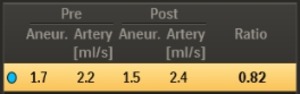
Fig. 12: The mean aneurysm flow and mean arterial flow measurements for the pre-deployment and post-deployment runs are shown, and the MAFA-ratio as defined above is calculated.
The time intensity curves of the contrast density inside the measurement outline can be plotted (Figure 13):
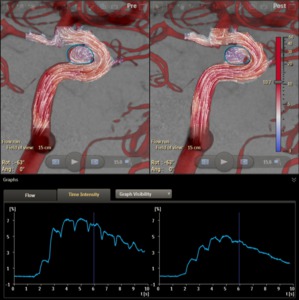
Fig. 13: Flow vector fields pre- and post-stenting, with the time-intensity curves of the contrast density inside the aneurysm outline.
References: NEURI center, Beaujon University Hospital, Paris, France
The average flow velocity within the outline as a function of time can be plotted (Figure 14):
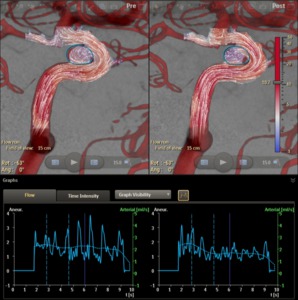
Fig. 14: The flow velocity averaged within the aneurysm outline as a function of time.
References: NEURI center, Beaujon University Hospital, Paris, France
