Response to cytotoxic chemotherapy on imaging is typically characterized by a prompt reduction in size of treated lesions.
This classical pattern of response is not always seen in patients responding to treatment with checkpoint inhibitors.
Several novel patterns of treatment response have been described which can make response assessment in these patients challenging.
In addition,
there are numerous immune-mediated side effects,
several of which have imaging correlates that can mimic disease progression and add to difficulty in determining treatment response.
Treatment response
In patients who receive to immunotherapy,
4 distinct patterns of tumor response have been described some of which differ from the classical response to cytotoxic chemotherapy.
[6].
1.
Decrease in size of tumour.
This is the traditional response as seen in tumours responding to cytotoxic chemotherapeutic agents.
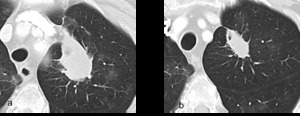
Fig. 2: a and b are serial axial post contrast CT images of the lungs. Tumour in the left upper lobe at initiation of treatment and imaging performed 12 weeks later demonstrating a reduction in size of tumour burden as traditionally seen in tumour responding to chemotherapeutic agents
References: Dept of Radiology, Memorial Sloan Kettering Cancer Center, New York, United States
2.
Stable disease,
followed by a slow reduction in overall tumour burden.

Fig. 3: Figure 3a, b and c are serial axial CT images of the lungs obtained at Week 0, Week 8 and Week 16 respectively. Figure 3a is a baseline study prior to initiation of immunotherapy.
At Week 8 there is no change in size of pulmonary metastasis (figure 3b, red arrow).
The patient remained on immunotherapy and imaging at Week 16 demonstrates a gradual decrease in size (red arrow).
References: Dept of Radiology, Memorial Sloan Kettering Cancer Center, New York, United States
3.
Initial increase in size of tumour before demonstrating treatment response.

Fig. 4: Figures 4a, b and c are serial axial post contrast CT images obtained at Week 0, Week 8 and Week 12 respectively.
Week 0 is the baseline study prior to initiation of immunotherapy for non-small cell lung carcinoma. At Week 8 the primary neoplasm is increased in size and more solid in appearance. This would have been categorised as disease progression using WHO or RECIST criteria.
At Week 14 the primary neoplasm in now smaller in size and less solid than on the initial baseline study. These appearances are consistent with treatment response having initially demonstrated pseudo-progression on the interval study.
References: Dept of Radiology, Memorial Sloan Kettering Cancer Center, New York, United States
4.
Appearance of new lesions after treatment initiation followed by treatment response.
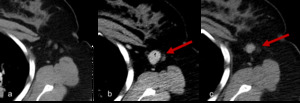
Fig. 5: Figure 5a, 5b and 5c are axial post contrast CT images obtained at Week 0, Week 8 and Week 12 of treatment.
Figure 5a demonstrates initial imaging obtained at baseline with non-measurable lymph nodes in the left axilla. At Week 8 after initiation of immunotherapy a newly enlarged lymph node has appeared. Using RECIST 1:1 criteria this new lesion would be deemed disease progression and indicative of treatment failure, however imaging obtained 4 weeks later with patient remaining on treatment now demonstrates a reduction in size consistent with treatment response.
References: Dept of Radiology, Memorial Sloan Kettering Cancer Center, New York, United States
Pseudo-progression
The phenomenon by which the tumor burden increases and then ultimately decreases is frequently referred to as pseudo-progression.
It occurs in a minority of patients with reported incidences of 9.7% in melanoma and 3-7% in lung cancer [6,
7].
There are 2 explanations for pseudo-progression following initiation of immunotherapy.
Biopsies have demonstrated transient infiltration of the tumour with immune cells,
accounting for increase in size on imaging.
Secondly,
the tumour may actually undergo continued growth until the immune system is sufficiently augmented to initiate tumour destruction [8].
Response assessment criteria
The most commonly used response assessment criteria in clinical trials of cancer therapy are the response evaluation criteria in solid tumors (RECIST 1:1).
Using RECIST 1.1 disease progression is defined by the appearance of new lesions or an increase in tumor size of >20%.
The use of RECIST 1:1 to assess tumour response in patients receiving immunotherapy can result in some patients being incorrectly identified as having disease progression based on some of the novel responses tumours have demonstrated on immunotherapy.
This has resulted in the need for new response evaluation criteria in the assessment of immunotherapy patients,
with two sets of criteria currently in use,
immune related response criteria (irRC) and immune related response evaluation criteria in solid tumors (irRECIST).
The main difference between these immunotherapy specific guidelines and RECIST 1.1,
occurs in the settings of increased or new lesions.
Instead of treatment cessation at the time of new lesion detection,
new lesions are incorporated into overall tumour burden and the patient continues on treatment.
Similarly,
if the tumor burden increases by >20% the patient may continue on treatment (Table 1).
When new lesions appear or there is apparent target lesion progression,
repeat imaging should be performed at least 4 weeks later with reassessment as to whether the findings represented true progression or pseudo-progression.
In true progression,
overall tumour burden will continue to increase whereas in pseudo-progression it should decline [6].
A formal guideline on this topic from the RECIST working group is expected in 2017.
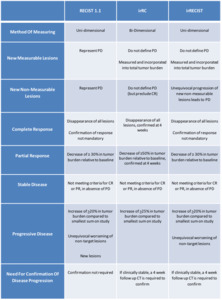
Table 1: PD = progressive disease; CR = complete response; CT = computed tomography; PR= Partial Response
References: Dept of Radiology, Memorial Sloan Kettering Cancer Center, New York, United States
Adverse Effects
Stimulation of the immune system can result in immune-related adverse effects,
which clinically manifest as autoimmune type processes,
and can affect many organ systems,
most commonly skin,
endocrine,
gastrointestinal and respiratory systems,
many of which are detectable radiologically.
In some cases the radiological appearance of immune-related adverse effects can mimic disease progression and cloud the radiologists’ interpretation.
CTLA-4 inhibitors appear to have increased risk and severity of some immune-related adverse effects compared with PD1-PDL1 inhibitors [9,
10].
Interestingly the presence of an immune-related adverse effect has been shown to correlate positively with treatment efficacy and treatment response of the primary tumour.
One study found that in those who had radiological evidence of immune-related adverse effects,
55% had evidence of disease control and 25% had a complete response,
versus 10% and 3% respectively in those who did have any radiological manifestations of immune-related adverse effects [11,
12].
Immune-related adverse effects of the thorax
Pneumonitis
Immunotherapy related pneumonitis can have a wide range of radiological manifestations but the most common pattern of disease radiologically is organizing pneumonia.
Other possible pattern of disease include hypersensitivity pneumonitis,
nonspecific interstitial pneumonia and acute interstitial pneumonia [13].
Pneumonitis can be seen in up to 5% of patients and in severe cases can be a cause of treatment-related mortality [3].
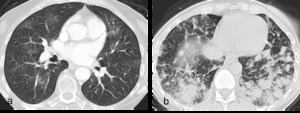
Fig. 6: Figure 6a. Axial post contrast CT images of the lungs showing bilateral multifocal ground glass opacities.
Figure 6b. Axial post contrast CT images with more confluent, peripheral opacities in a morphology similar to cryptogenic organising pneumonia.
References: Dept of Radiology, Memorial Sloan Kettering Cancer Center, New York, United States

Fig. 7: Figures 7a, b, c and d are post contrast axial CT images of the lungs of a 68 year old male on immunotherapy for lung cancer.
Figure 7b obtained 8 weeks after Figure 7a shows interval development of increased and new multiple lung opacities.
Subsequent biopsy was obtained which demonstrated organizing pneumonia (figure 7c). The patient was commenced on steroids and follow-up imaging at 2 months demonstrated almost complete resolution of multiple lung opacities (figure 7d).
References: Dept of Radiology, Memorial Sloan Kettering Cancer Center, New York, United States
Sarcoid-like reaction
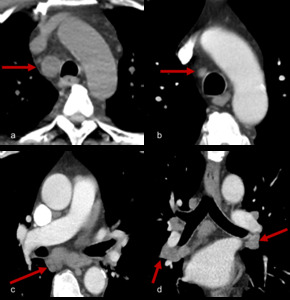
Fig. 8: Figure 8a, b, c and d are serial axial post contrast CT images of a 54 year patient with melanoma resected from his shoulder.
Surveillance imaging (figure 8a) revealed right paratracheal adenopathy which was biopsy proven to be a melanoma recurrence. The patient was commenced on immunotherapy with treatment response and reduction in size of metastatic lymph node (figure 8b).
Six months later paratracheal and bihilar adenopathy developed (figure 8c and 8d, axial and coronal CT images of the mediastinum). Tissue obtained was negative for malignancy and instead demonstrated a reactive “sarcoid-like” reaction.
This type of reaction has been documented in a number of cases with case reports of patients also developing sarcoid associated skin lesions or neurosarcoidosis [12, 14].
References: Dept of Radiology, Memorial Sloan Kettering Cancer Center, New York, United States
Tracheitis
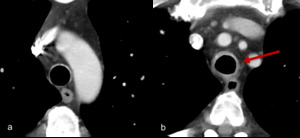
Fig. 9: Figures 9a and 9b. Axial post contrast images of the mediastinum in a patient on ipilimumab and nivolumab.
This patient presented with coughing and stridor. Imaging demonstrates new circumferential soft tissue thickening of the trachea consistent with tracheitis.
References: Dept of Radiology, Memorial Sloan Kettering Cancer Center, New York, United States
Myocarditis
In general,
cardiac toxicity related to checkpoint blockade is rare but heart failure,
cardiomyopathy,
heart block and myocarditis have all been reported [15].
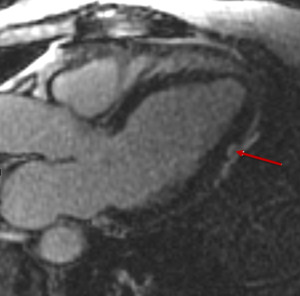
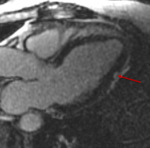
Fig. 10: 71 year old patient with melanoma treated with ipilimumab and nivolumab. A routine ECG during treatment demonstrated new ST segment elevation. The patient was asymptomatic. Troponin levels were mildly elevated. Coronary angiography did not demonstrate any obstructive coronary disease.
Figure 10 is a T1 weighted post contrast 3 chamber image from a cardiac MRI take at the time of the event. It demonstrates an area of myocardial enhancement in a non-ischemic pattern (arrow). A diagnosis of suspected immunotherapy related myocarditis was made.
References: Dept of Radiology, Memorial Sloan Kettering Cancer Center, New York, United States
Immune-related adverse effects of the abdomen
Colitis
Diarrhea is a common symptom in patients recieving immunotherapy,
present in up to 45% of patients,
with CT evidence of colitis present in 5%.
In mild cases symptoms may be treated with anti-diarrheal agents.
Worsening or persistence of symptoms should prompt endoscopic and radiologic evaluation and treatment with oral steroids.
Severe cases may require inpatient admission and use of infliximab,
a monoclonal antibody used in the treatment of inflammatory bowel disease [10,
12].
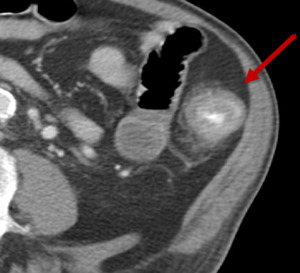
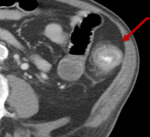
Fig. 11: Figure 11, Axial post intravenous and oral contrast of the abdomen demonstrating a loop of diffusely thickened large bowel, with mucosal enhancement and peri-colonic fat stranding consistent with colitis (red arrow).
References: Dept of Radiology, Memorial Sloan Kettering Cancer Center, New York, United States
Pancreatitis
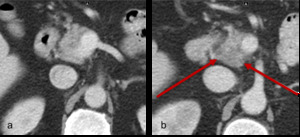
Fig. 12: Figure 12a and b. Axial post contrast CT images of the pancreas in a man on ipililmumab and nivolumab. Figure 12a is the appearance of the pancreas prior to commencing treatment. Patient then presented with abdominal pain and raised amylase and CT imaging demonstrates oedema of the pancreatic head with peri-pancreatitc fat stranding consistent with pancreatitis (figure 12b).
References: Dept of Radiology, Memorial Sloan Kettering Cancer Center, New York, United States
Immune-related adverse effects of the endocrine system
Hypophysitis has been reported in 1-6% of patients undergoing treatment for melanoma with ipilimumab [12,
16].
Other adverse effects include hypo- and hyperthyroidism which occur following infiltration of the thyroid with cytotoxic T-lymphocytes,
and adrenal insufficiency.
Hypophysitis

Fig. 13: Figures 13a, b and c are sagittal T1 post contrast images of the brain are taken at Week 0, Week 4 and Week 12 of a patient on immunotherapy.
Figure 13b demonstrates an enlargement of the pituitary gland with thickening and enhancement of the infundibulum consistent with hypophysitis, which resolved once patient was taken off immunotherapy, (figure 13c). The incidence of hypophysitis ranges from 1-6% on a single agent and 2-10% on combination therapies [10].
Courtesy Dr. Robert Young
References: Dept of Radiology, Memorial Sloan Kettering Cancer Center, New York, United States
Thyroiditis
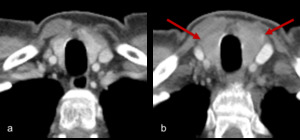
Fig. 14: Figure 14a and b are axial post contrast CT images of the thyroid. Figure 14a is the baseline appearance of the thyroid prior to commencing treatment.
Figure 14b demonstrates diffuse enlargement of the thyroid with reduced, heterogeneous enhancement with corresponding symptoms and thyroid biochemistry consistent with thyroiditis.
References: Dept of Radiology, Memorial Sloan Kettering Cancer Center, New York, United States
Future Directions
Molecular imaging techniques are in development that could aid in the selection of patients who may benefit from immunotherapy,
and which could help to monitor patients receiving therapy.
For example,
a pre-clinical model which uses a radiolabeled anti-PD-L1 antibody allows in vivo evaluation of tumor PD-L1 levels and holds promise for helping patient selection for PD-1 and PD-L1–targeted therapy [17].




![Fig. 8: Figure 8a, b, c and d are serial axial post contrast CT images of a 54 year patient with melanoma resected from his shoulder.
Surveillance imaging (figure 8a) revealed right paratracheal adenopathy which was biopsy proven to be a melanoma recurrence. The patient was commenced on immunotherapy with treatment response and reduction in size of metastatic lymph node (figure 8b).
Six months later paratracheal and bihilar adenopathy developed (figure 8c and 8d, axial and coronal CT images of the mediastinum). Tissue obtained was negative for malignancy and instead demonstrated a reactive “sarcoid-like” reaction.
This type of reaction has been documented in a number of cases with case reports of patients also developing sarcoid associated skin lesions or neurosarcoidosis [12, 14]. References: Dept of Radiology, Memorial Sloan Kettering Cancer Center, New York, United States](https://epos.myesr.org/posterimage/esr/ecr2017/137942/media/693836?maxheight=150&maxwidth=150)


![Fig. 13: Figures 13a, b and c are sagittal T1 post contrast images of the brain are taken at Week 0, Week 4 and Week 12 of a patient on immunotherapy.
Figure 13b demonstrates an enlargement of the pituitary gland with thickening and enhancement of the infundibulum consistent with hypophysitis, which resolved once patient was taken off immunotherapy, (figure 13c). The incidence of hypophysitis ranges from 1-6% on a single agent and 2-10% on combination therapies [10].
Courtesy Dr. Robert Young References: Dept of Radiology, Memorial Sloan Kettering Cancer Center, New York, United States](https://epos.myesr.org/posterimage/esr/ecr2017/137942/media/696949?maxheight=150&maxwidth=150)


