This poster is published under an
open license. Please read the
disclaimer for further details.
Keywords:
Computer applications, Liver, Interventional vascular, MR-Functional imaging, Image manipulation / Reconstruction, Segmentation, Radioembolisation, Computer Applications-General, Cancer
Authors:
S. Thoduka1, P. Schilling1, G. Chlebus2, A. Schenk2, N. Abolmaali1; 1Dresden/DE, 2Bremen/DE
DOI:
10.1594/ecr2017/C-2917
Results
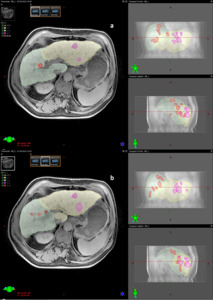
Fig. 2: Segmentation performed by the expert(a) and novice (b) using using Gd-EOB-DTPA-enhanced late phase MRI scans of the same patient in the contouring Software EclipseTM from Varian Medical Systems showing the inter-observer-variability in dividing the liver into the two lobes as well as in identification of liver tumours.
The average left and right liver lobes as measured by the expert were 652.32cc and 1314.61cc,
respectively and those measured by the novice were 703.19cc and 1309.39cc,
respectively.
We calculated the total average liver volume by the expert to equal 1966.9cc and 2011.6cc by the novice,
constituting an absolute mean difference of 4.3%.
The average tumour volumes in the left and right lobes as measured by the expert were 106.62cc and 300.26cc,
respectively.
The novice measured an average tumour volume of 130.90cc and 341.51cc in the left and right liver lobes,
respectively.
The average tumour volume in the two lobes measured by the expert was 407cc and that measured by the novice was 472cc with an absolute mean difference of 42.6%.
The average calculated tumour to liver volume measurement by the expert and the novice were 18.1 and 20.4%,
respectively.
The segmentation of the left and right liver lobes showed an average Dice similarity coefficient of 0.87±0.05.
The average Dice similarity coefficient for contours of tumours in the liver lobes was 0.59±0.21.
Table 2. Results comparing volumetry performed by the expert and novice with corresponding Inter-class correlation coefficient (ICC) using Gd-EOB-DTPA-enhanced late phase MRI scans (n=38).
|
Measurement
|
Expert
|
Novice
|
ICC
|
|
Total avg.
liver volume :
· Left liver lobe
· Right liver lobe
|
1966.9±705.4 ml
652.32±246.99ml
1314.61±540.2 ml
|
2011.6±703.9 ml
703.19±257.56 ml
1308.39±548.53 ml
|
0.99
0.85
0.97
|
|
Total avg.
tumour volume :
· Tumour in left lobe
· Tumour in right lobe
|
406.9±466.76 ml
106.62±122.72 ml
300.26±464.03 ml
|
472.4±515.26 ml
130.90±137.65 ml
341.51±472.44 ml
|
0.94
0.77
0.94
|
|
Avg.
percentage of tumour/ liver
|
18.1%
|
20.4%
|
0.90
|
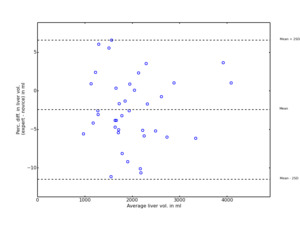
Fig. 3: Bland-Altman analysis for inter-observer-variability in liver volumetry between expert and novice using Gd-EOB-DTPA-enhanced late phase MRI scans in Varian-Eclipse. Each point represents a patient MRI scan set where the liver was segmented into left and right lobes. The horizontal axis indicates the mean measurement of the two users, and the degree of dispersion around the horizontal axis represents the variability in the measurements between the expert and the novice.
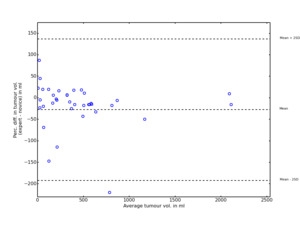
Fig. 4: Bland-Altman analysis for inter-observer-variability in tumour volumetry between expert and novice using Gd-EOB-DTPA-enhanced late phase MRI scans in Varian-Eclipse. Each point represents a patient MRI scan set where the tumours was segmented into left and right lobes. The horizontal axis indicates the mean measurement of the two users, and the degree of dispersion around the horizontal axis represents the variability in the measurements between the expert and the novice.
Table 3. Dice similarity coefficient of spatial overlap between liver and tumour segmentations by the expert and novice on Gd-EOB-DTPA- enhanced late phase MRI scans (n=38).
|
Structure
|
Average dice similarity coefficient
|
|
Total average liver (left + right lobe)
· Left liver lobe
· Right liver lobe
|
0.87±0.05
0.84±0.07
0.91±0.04
|
|
Total average tumour (left + right lobe)
· Tumour in left lobe
· Tumour in right lobe
|
0.59±0.21
0.55±0.27
0.62±0.26
|

 and novice (b) using using Gd-EOB-DTPA-enhanced late phase MRI scans of the same patient in the contouring Software EclipseTM from Varian Medical Systems showing the inter-observer-variability in dividing the liver into the two lobes as well as in identification of liver tumours.")

