Keywords:
Anatomy, Neuroradiology brain, MR, Segmentation, Education and training
Authors:
M. Laganà1, S. Carrara1, M. Olmi2, M. Cresti2, L. Forzoni3, P. Cecconi4; 1Milano/IT, 2Genova/IT, 3Firenze/IT, 4Como (CO)/IT
DOI:
10.1594/ecr2018/C-1387
Conclusion
Cortical and subcortical GM volumes were underestimated (range 0.1-10.3%) and WM volume was overestimated (range 1.3-4.8%) by 0.25 T compared to 1.5 T,
likely because parts of the cortical GM were misclassified as WM (as shown in Figure 3).
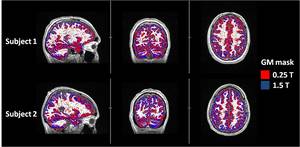
Fig. 3: Grey matter (GM) segmentation results at 1.5 T and 0.25 T. The GM masks obtained from 0.25 T (red) and 1.5 T (blue) are superimposed to the MPRAGE. The 0.25 T GM mask (red) is superimposed to the 1.5 T GM mask (blue), in order to highlight the regional differences. The 0.25 T 3D T1 was coregistered to the 1.5 T one, for Subject 1 (upper panel) and Subject 2 (lower panel).
References: Fondazione Don Carlo Gnocchi ONLUS, Milan, Italy
The differences of tissue volumes computed using different scanners and positions,
although higher than the repeatability at 1.5 T,
were in line with the repeatability reported in a specific study using a 3 T scanner [7].
Since SNR is directly dependent on magnetic field strength [1],
we expected that the ratio between the SNR at 0.25 T and 1.5 T was 0.25/1.5=0.17.
Brain SNR of the 0.25 T vs 1.5 T images was equal or higher than expected (range of the normalized ratios: 0.17 to 0.21),
probably thanks to the Speed Up technique.
The tissues were well contrasted also in the 0.25 T acquisitions,
although some cortical regions were critical because their gray-level at 0.25 T was similar to the WM one,
or to the surrounding CSF (Figure 1).
The Contrast of the different tissues was always higher at 1.5 T compared to the one obtained at 0.25 T,
as expected.
However,
the differences between scanners in terms of tissue volumes (2nd and 3rd columns of Table 1: range 0.08–10.33%) were lower compared to the contrast differences between scanners (Table 2: range 1.55–14.64%).
