Anatomy
There are two triangles in each posterior fossa.
The superior vertex of the triangle is formed by the red nucleus in the midbrain,
the inferior vertex is formed by the ipsilateral inferior olivary nucleus in the medulla,
and the middle vertex is formed by the contralateral dentate nucleus in the cerebellum.
(Fig. 1 and Fig. 2)
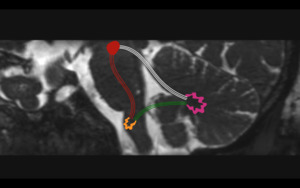
Fig. 1: Triangle of Guillain and Morallet. Representation of the triangle of Guillain and Morallet on oblique sagittal T2WI. The superior vertex of the triangle is formed by the red nucleus (red circle) in the midbrain, the inferior vertex by the ipsilateral inferior olivary nucleus in the medulla (orange), and the middle vertex by the contralateral dentate nucleus in the cerebellum (pink). Also depicted are the afferent rubro-olivary pathway (red lines), the afferent dentate-rubro tract (white lines), and the indirect efferent olivo-dentate pathway.
References: Link Diagnostico Digital, Medellin, Colombia 2018
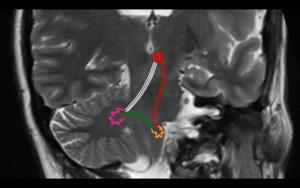
Fig. 2: Triangle of Guillain and Morallet. Representation of the triangle of Guillain and Morallet on oblique coronal T2WI. The superior vertex of the triangle is formed by the red nucleus (red circle) in the midbrain, the inferior vertex by the ipsilateral inferior olivary nucleus in the medulla (orange), and the middle vertex by the contralateral dentate nucleus in the cerebellum (pink). Also depicted are the afferent rubro-olivary pathway (red lines), the afferent dentate-rubro tract (white lines), and the indirect efferent olivo-dentate pathway (efferent).
References: Link Diagnostico Digital, Medellin, Colombia 2018
These three nuclei are connected by a set of afferent and efferent pathways (Fig. 3); the dentate-rubro pathway (afferent),
the rubro-olivary pathway (afferent),
and the indirect olivo-cerebellar pathway (efferent).
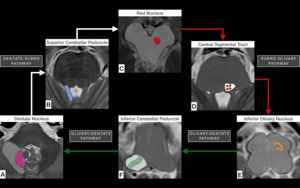
Fig. 3: Schematic representation of the nuclei and tracts that form the triangle of Guillain and Morallet on T2WI. From the contralateral dentate nucleus (pink in A) in the cerebellar white matter, the dentate-rubro pathway (white arrows from A to C and white lines in B) travel through the superior cerebellar peduncle (highlighted in blue in B) and connect to the ipsilateral red nucleus (red in C). The pathway continues inferiorly from the red nucleus through the midbrain and pons as rubro-olivary pathway (red arrows from C to E and red dots in D) which travels through the central tegmental tract (highlighted in white in D) and connects with the ipsilateral inferior olivary nucleus (orange in E). From the ipsilateral inferior olivary nucleus, indirect fibers via the olivary-dentate pathway (green arrows from E to A and green lines in F) travel through the inferior cerebellar peduncle (highlighted in white in F) connect to the contralateral dentate nucleus in the cerebellum.
References: Link Diagnostico Digital, Medellin, Colombia 2018
The first segment of the afferent pathway is formed by the dentate-rubro pathway (Fig. 4) which originates in the contralateral dentate nucleus and connects to the ipsilateral red nucleus via the superior cerebellar peduncle.
The afferent pathway continues inferiorly through the midbrain and pons as rubro-olivary pathway (Fig. 5) located in the central tegmental tract which connects the ipsilateral red nucleus with the ipsilateral inferior olivary nucleus.
Finally,
indirect efferent fibers from the ipsilateral inferior olivary nucleus cross through the inferior cerebellar peduncle to join the contralateral dentate nucleus [2].
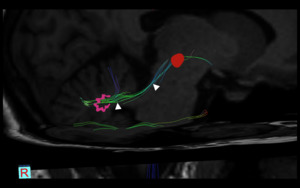
Fig. 4: Dentate-rubro pathway. Diffusion Tensor Imaging (DTI) depicting the fibers of the dentate-rubro pathway (white arrowheads) which connect the contralateral dentate nucleus (pink) with the ipsilateral red nucleus (red). A lesion in this location will produce contralateral HOD
References: Link Diagnostico Digital, Medellin, Colombia 2018
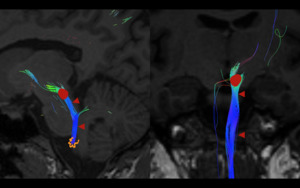
Fig. 5: Rubro-olivary pathway. Diffusion Tensor Imaging (DTI) depicting the fibers of the rubro-olivary pathway (red arrowheads), traveling through the central tegmental tract which connect the ipsilateral red nucleus (red) with the ipsilateral inferior olivary nucleus (orange). A lesion in this location will produce ipsilateral HOD
References: Link Diagnostico Digital, Medellin, Colombia 2018
Pathophysiology
HOD is somewhat unique because degeneration of the involved inferior olivary nucleus causes hypertrophy instead of atrophy.
Hypertrophy occurs because although the cerebellum is predominantly excitatory,
the primary function of the dentate nucleus is the inhibition of the inferior olivary nucleus via GABAergic projections.
If the afferent portions of the DRO pathway are interrupted by a lesion,
the inferior olivary nucleus is no longer inhibited and will therefore undergo hypertrophy [3].
Pathologically,
olivary enlargement corresponds to vacuolar degeneration of cytoplasm and a decreased number of astrocytes but an increased area of their cell bodies [4].
Only lesions affecting the afferent pathways (i.e.
the dentate-rubro pathway and the rubro-olivary pathway) (Fig. 6) will lead to HOD.
This occurs because,
as stated above,
the efferent fibers connecting the ipsilateral inferior olivary nucleus and the contralateral dentate nucleus (olivary-dentate pathway) are indirect fibers.
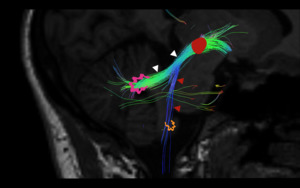
Fig. 6: Dentate-rubro and rubro-olivary pathways. Diffusion Tensor Imaging (DTI) depicting the afferent fibers of the DRO pathway which include the rubro-olivary pathway (red arrowheads) descending from the ipsilateral red nucleus (red circle) via the central tegmental tract to the ipsilateral inferior olivary nucleus (orange) and the dentate-rubro pathway (white arrowheads) which connect the contralateral dentate nucleus (pink) with the ipsilateral red nucleus (red circle). Only lesions affecting these afferent pathways will lead to HOD.
References: Link Diagnostico Digital, Medellin, Colombia 2018
Clinical Manifestations
The classic clinical manifestation of HOD is palatal myoclonus which usually develops approximately 10-11 months after the primary lesion.
Palatal myoclonus is defined as rhythmic involuntary movement of the oropharynx secondary to abnormal contractions of the levator veli palatine muscle.
These tremors may also involve the tongue,
diaphragm,
facial muscles and larynx [5,
6].
Less frequently,
patients may also present with a dentatorubral tremor also known as Holmes tremor which is defined as a rest and intention tremor below 4.5 Hz,
usually localized to one upper extremity that may have irregular amplitude [5,
6].
Etiology
HOD commonly develops secondary to hemorrhage,
infarction and vascular malformations in the DRO pathway but may also arise secondary to trauma,
post-surgical changes,
demylinating disease.
In extremely rare cases HOD has been documented to be idiopathic [7] and secondary to Wilsons disease [8].
Location of HOD
Lesions located in the DRO tract may produce 3 types of HOD depending of their location (Fig. 7):
- Contralateral HOD: Lesions in the dentate nucleus or dentate-rubro tract in the superior cerebellar peduncle.
(Lesion A in Fig. 7).
- Bilateral HOD: Lesions in the midline or paramedian pons near the superior cerebellar peduncle due to simulates involvement of the superior cerebellar peduncle and central tegmental tract.
(Lesion B in Fig. 7).
- Ipsilateral HOD: Lesions in the brainstem tegmentum which disrupt the rubro-olivary pathway in the central tegmental tract.
(Lesion C in Fig. 7).
Once again it is important to remember that interruption of the indirect efferent olivo-dentate tract fibers will not cause HOD.
Although most case reports and series in the literature describe HOD as being unilateral,
a 2014 retrospective review of 102 patients with HOD reported that 76% had findings bilaterally [9].
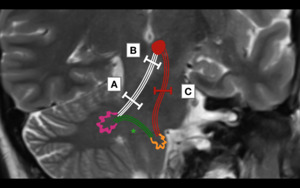
Fig. 7: Location of lesions leading to HOD. Lesions affecting the afferent dentate-rubro pathway (white lines) before decussation of the brachium conjunctivum (A) will lead to contralateral HOD. Lesions affecting the afferent dentate-rubro pathway (white lines) at the decussation of the brachium conjunctivum (B) will lead to bilateral HOD. Lesions affecting the afferent rubro-olivary pathway (red lines) as it descends through the central tegmental tract (C) will lead to ipsilateral HOD. (*)It is important to remember that the efferent fibers of the olivary-dentate pathway (green lines) are indirect and a lesion at this location will not produce HOD.
References: Link Diagnostico Digital, Medellin, Colombia 2018
Chronological Evolution of HOD
Chronological and morphometric analyses [4] have described six stages of pathologic olivary changes associated with destruction of the central tegmental tract in the pons: (1) No olivary change in the first 24 hours (2) degeneration of the olivary amiculum (capsule of white matter composing the periphery of the olivary nucleus) at two to seven days (3) mild olivary hypertrophy at three weeks (4) culminant olivary enlargement at eight and a half months (5) olivary pseudohypertrophy at nine and a half months (6) olivary atrophy after a few years.
In concordance with the six pathological stages associated with HOD,
four stages of MR imaging changes have been described (Fig. 8).
These studies establish the utility of MR imaging in assessing the chronological evolution of HOD.
[10,
11,
12].
In the early acute stage,
there are usually no olivary changes on MR imaging.
The first signs of olivary degeneration are observed during the second (acute) stage about one month after the insult.
Initially there is an increase in signal intensity of the olivary nucleus on long TR sequences,
primarily T2 weighted sequences and FLAIR,
followed by hypertrophy which is usually not observed until 6 months after the insult (intermediate stage).
These changes are hypothesized to be secondary to an increase in intracellular water content of enlarged neuronal bodies.
[13] and correlate with stages 3 and 4 of the chronological and morphometric analyses described by Goto et.
al.
[4] The late (chronic) stage begins when hypertrophy resolves around 3-4 years after the insult.
During this stage,
the size of the olivary nucleus may return to normal whereas the increase in signal intensity usually persists indefinitely.
T1 weighted images are nonspecific and may show hypo- iso- or hyperintense enlargement of the olivary nucleus.
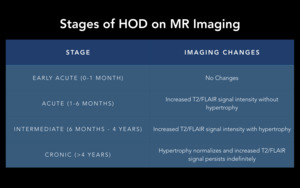
Fig. 8: Stages of HOD on MR Imaging.
References: Link Diagnostico Digital, Medellin, Colombia 2018
Therefore,
the hallmarks of HOD on MRI are:
- Hypertrophy of the affected inferior olivary nucleus (described as having a large and rounded appearance).
- Focal increase in signal intensity on sequences with long TR (T2WI and FLAIR) of the affected inferior olivary nucleus.
- Absence of restricted diffusion or contrast enhancement.
Cases
Patient 1 (Fig. 9)
53-year-old female patient with progressive bilateral lower extremity weakness.
A previous cervical MRI showed a possible cavernous malformation in the pons and a complimentary cerebral MRI was ordered.
The MRI shows multiple reticular “popcorn ball” lesions which are predominantly T1 and T2 hyper-intense with hypo-intense rim (hemosiderin) and prominent susceptibility weighted imaging effect consistent with multiple cavernous malformations located in the right cerebellar hemisphere and right pons in the localization of the right central tegmental tract.
On T2 and FLAIR imaging there is an abnormally enlarged and hyperintense right inferior olivary nucleus.
Findings are consistent with a lesion in the right rubro-olivary pathway,
producing an ipsilateral HOD.
According to the four stages described in MR imaging (table in Fig. 8),
the lesion is most likely at the intermediate stage.
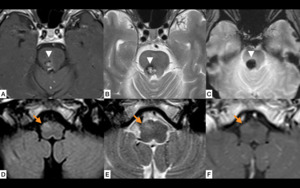
Fig. 9: Ipsilateral HOD. T1WI (A) and T2WI (B) show a predominantly hyper-intense lesion (white arrowheads A-C) in the right pons with hypointense rim (hemosiderin) and prominent susceptibility weighted (SWI) imaging effect (C) consistent with a cavernous malformation. The lesion is located at the level of the right central tegmental tract, affecting the fibers of the afferent rubro-olivary pathway (Location C in Fig. 7). Axial fluid attenuation inversion recovery (FLAIR) (D), T2WI (E) and T1WI (F) images at the level of the medulla show increased signal intensity in the right inferior olivary nucleus (orange arrows D-F) consistent with ipsilateral HOD, most likely in an intermediate stage of evolution (See table in Fig 8).
References: Link Diagnostico Digital, Medellin, Colombia 2018
Patient 2 (Fig. 10)
61-year-old male patient with suspected posterior fossa ischemic infarct.
Magnetic resonance images show increased FLAIR and T2WI signal intensity in the right dentate nucleus of the cerebellum and surrounding white matter.
The finding is consistent with gliosis due to a previous lacunar infarct.
Axial FLAIR,
T2WI and B1000 images at the level of the medulla show increased size and increased signal intensity in the left inferior olivary nucleus without restricted diffusion consistent with contralateral HOD,
most likely in an intermediate stage of evolution (See table in Fig. 8).
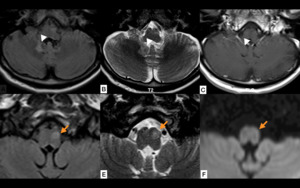
Fig. 10: Contralateral HOD. Axial fluid attenuation inversion recovery (FLAIR) (A) and T2WI (B) show focal increased signal intensity in the right dentate nucleus of the cerebellum and surrounding white matter without contrast enhancement on T1WI (C) consistent with gliosis due to a previous lacunar infarct (white arrowheads). The lesion is affecting the fibers of the dentate-rubro pathway (Location A in Fig. 7). Axial fluid attenuation inversion recovery (FLAIR) (D), T2WI (E) and B1000 (F) images at the level of the medulla show increased size and increased signal intensity in the left inferior olivary nucleus without restricted diffusion (orange arrows D-F) consistent with contralateral HOD, most likely in an intermediate stage of evolution (See table in Fig 8).
References: Link Diagnostico Digital, Medellin, Colombia 2018
Differential Diagnosis
The differential diagnosis of HOD includes any T2/FLAIR hyperintense lesion in the anterior pontomedullary region (Fig. 11) [14],
including:
- Infarction
- Infection (Tuberculosis,
rhomboencephalitis)
- Demyelination
- Tumors (primary brainstem astrocytoma or metastasis)
- Inflammatory process
Absence of contrast enhancement helps rule out infectious diseases and tumoral lesions while absence of restricted diffusion helps rule out acute infarcts and inflammatory/infectious diseases.
Identifying the causative lesion in the DRO pathway along with the appropriate timing of imaging findings in the inferior olivary nucleus is key to establishing the diagnosis.
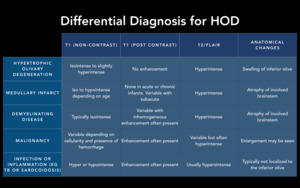
Fig. 11: Differential Diagnosis for HOD
References: Gatlin J, Wineman R, Schlakman B, Buciuc R, Khan M. Hypertrophic Olivary Degeneration After Resection of a Pontine Cavernous Malformation: A Case Report. Journal of Radiology Case Reports. 2011;5(3)

 in the midbrain, the inferior vertex by the ipsilateral inferior olivary nucleus in the medulla (orange), and the middle vertex by the contralateral dentate nucleus in the cerebellum (pink). Also depicted are the afferent rubro-olivary pathway (red lines), the afferent dentate-rubro tract (white lines), and the indirect efferent olivo-dentate pathway. References: Link Diagnostico Digital, Medellin, Colombia 2018")
 in the midbrain, the inferior vertex by the ipsilateral inferior olivary nucleus in the medulla (orange), and the middle vertex by the contralateral dentate nucleus in the cerebellum (pink). Also depicted are the afferent rubro-olivary pathway (red lines), the afferent dentate-rubro tract (white lines), and the indirect efferent olivo-dentate pathway (efferent). References: Link Diagnostico Digital, Medellin, Colombia 2018")
 in the cerebellar white matter, the dentate-rubro pathway (white arrows from A to C and white lines in B) travel through the superior cerebellar peduncle (highlighted in blue in B) and connect to the ipsilateral red nucleus (red in C). The pathway continues inferiorly from the red nucleus through the midbrain and pons as rubro-olivary pathway (red arrows from C to E and red dots in D) which travels through the central tegmental tract (highlighted in white in D) and connects with the ipsilateral inferior olivary nucleus (orange in E). From the ipsilateral inferior olivary nucleus, indirect fibers via the olivary-dentate pathway (green arrows from E to A and green lines in F) travel through the inferior cerebellar peduncle (highlighted in white in F) connect to the contralateral dentate nucleus in the cerebellum. References: Link Diagnostico Digital, Medellin, Colombia 2018")
 depicting the fibers of the dentate-rubro pathway (white arrowheads) which connect the contralateral dentate nucleus (pink) with the ipsilateral red nucleus (red). A lesion in this location will produce contralateral HOD References: Link Diagnostico Digital, Medellin, Colombia 2018")
 depicting the fibers of the rubro-olivary pathway (red arrowheads), traveling through the central tegmental tract which connect the ipsilateral red nucleus (red) with the ipsilateral inferior olivary nucleus (orange). A lesion in this location will produce ipsilateral HOD References: Link Diagnostico Digital, Medellin, Colombia 2018")
 depicting the afferent fibers of the DRO pathway which include the rubro-olivary pathway (red arrowheads) descending from the ipsilateral red nucleus (red circle) via the central tegmental tract to the ipsilateral inferior olivary nucleus (orange) and the dentate-rubro pathway (white arrowheads) which connect the contralateral dentate nucleus (pink) with the ipsilateral red nucleus (red circle). Only lesions affecting these afferent pathways will lead to HOD. References: Link Diagnostico Digital, Medellin, Colombia 2018")
 before decussation of the brachium conjunctivum (A) will lead to contralateral HOD. Lesions affecting the afferent dentate-rubro pathway (white lines) at the decussation of the brachium conjunctivum (B) will lead to bilateral HOD. Lesions affecting the afferent rubro-olivary pathway (red lines) as it descends through the central tegmental tract (C) will lead to ipsilateral HOD. (*)It is important to remember that the efferent fibers of the olivary-dentate pathway (green lines) are indirect and a lesion at this location will not produce HOD. References: Link Diagnostico Digital, Medellin, Colombia 2018")

 and T2WI (B) show a predominantly hyper-intense lesion (white arrowheads A-C) in the right pons with hypointense rim (hemosiderin) and prominent susceptibility weighted (SWI) imaging effect (C) consistent with a cavernous malformation. The lesion is located at the level of the right central tegmental tract, affecting the fibers of the afferent rubro-olivary pathway (Location C in Fig. 7). Axial fluid attenuation inversion recovery (FLAIR) (D), T2WI (E) and T1WI (F) images at the level of the medulla show increased signal intensity in the right inferior olivary nucleus (orange arrows D-F) consistent with ipsilateral HOD, most likely in an intermediate stage of evolution (See table in Fig 8). References: Link Diagnostico Digital, Medellin, Colombia 2018")
 (A) and T2WI (B) show focal increased signal intensity in the right dentate nucleus of the cerebellum and surrounding white matter without contrast enhancement on T1WI (C) consistent with gliosis due to a previous lacunar infarct (white arrowheads). The lesion is affecting the fibers of the dentate-rubro pathway (Location A in Fig. 7). Axial fluid attenuation inversion recovery (FLAIR) (D), T2WI (E) and B1000 (F) images at the level of the medulla show increased size and increased signal intensity in the left inferior olivary nucleus without restricted diffusion (orange arrows D-F) consistent with contralateral HOD, most likely in an intermediate stage of evolution (See table in Fig 8). References: Link Diagnostico Digital, Medellin, Colombia 2018")
")