The pathological substrate of CAA-ri is the presence of an inflammatory response induced by the deposition of amyloid-β protein.
It can be categorized into two pathologic subtypes: a non-destructive inflammatory infiltration called CAA-related inflammation (CAA-ri) and a transmural inflammatory infiltrate with or without granuloma called amyloid β-related angiitis (ABRA) [8].
However,
both entities have similar clinical and radiologic features and cannot be distinguished on neuroimaging [9].
The main radiological feature of CAA-ri is the onset of vasogenic oedema arising on previous haemorrhagic foci (Fig. 2) [5].
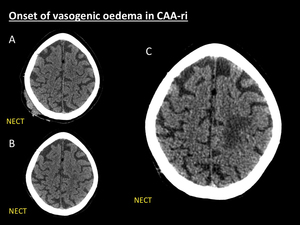
Fig. 2: Onset of vasogenic oedema in CAA-ri. 75-year-old woman who was scanned one year ago at ER due to head trauma. NECT (A) showed right parietal subgaleal and soft tissue haematoma without intracranial complications. One year later the patient complained of progressive headache and rapid mental deterioration. New NECT (B) at ER was then performed demonstrating left upper parietal white matter hypodensity with subtle effaced sulci. In the next days the condition of the patient rapidly aggravated, thereby resulting in hospitalization. Next NECT (C), five days after (B), demonstrated marked left parietal white matter hypodensity with increasing mass effect (C) suggestive of vasogenic oedema.
On non-enhanced CT imaging,
it manifests as single or multiple asymmetrical subcortical hypodensities,
usually with mass effect,
attributed to vasogenic oedema,
with or without other signs of acute or previous lobar haemorrhage.
Due to the lack of sensitivity of CT in the demonstration of microhaemorrhages further investigation with MRI is mandatory to clarify the origin of the areas of parenchymal oedema.
After contrast administration,
CT may or may not show subtle enhancement of cortex and sulci adjacent to areas of vasogenic oedema (Fig. 3) [4].
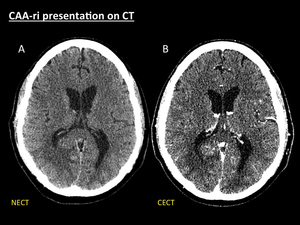
Fig. 3: CAA-ri presentation on CT. 68-year-old patient with stroke-like symptoms and seizures. Axial NECT (A) shows a right parieto-occipital geographical area of white matter hypodensity that spares cortex with effaced sulci and mass effect collapsing atrium and occipital horn of right lateral ventricle, suggestive of vasogenic oedema. A CECT (B) was performed to rule out an enhancing tumour responsible for the vasogenic oedema. No enhancing intra- or extraaxial lesions were seen. In this cases MRI is mandatory to further investigate the cause of parenchymal oedema.
Radiological features of CAA-ri are better depicted with MRI.
Imaging protocol should include T1-weighted,
T2-weighted,
FLAIR,
T2*-weighted (GRE T2) or susceptibility-weighted (SWI),
and diffusion-weighted (DWI) sequences.
Enhanced T1-weighted sequences are not mandatory to make the CAA-ri diagnosis,
but they are useful to exclude other causes of vasogenic oedema such as metastases.
The clue findings of CAA-ri on MRI include [5]:
● Reversible,
asymmetrical,
patchy or confluent hyperintensities,
more often with mass effect,
on T2-weighted and FLAIR sequences,
without restricted diffusion on the ADC map,
usually related to macro- or microhaemorrhages seen on T2*/SWI sequences (Fig. 4) (Fig. 5).
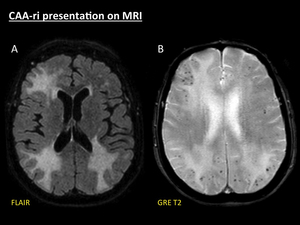
Fig. 4: CAA-ri presentation on MRI. Axial fat-suppressed FLAIR (A) demonstrates three areas of white matter hyperintensity with effaced sulci. GRE T2 (B) shows multiple punctate cortical and cortical-subcortical hypointensities, related to microbleeds, selectively distributed in the same areas of vasogenic oedema.
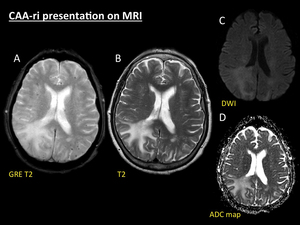
Fig. 5: CAA-ri presentation on MRI. Same patient as in Fig. 5. GRE T2 (A) reveals multiple punctate cortical and cortical-subcortical microbleeds in both hemispheres. On TSE T2 sequence (B) a huge area of right parieto-occipital white matter hyperintensity is seen, sparing the cortex, depicting vasogenic oedema. Note the perfect correlation to the distribution of the parenchymal hypodensity seen on NECT. This area of oedematous involvement shows high signal intensity on both b-1000 DWI (C) and ADC map (D), therefore confirming that hyperintensity on DWI is due to T2 shine-trough phenomenon.
● Occasionally leptomeningeal or even blurred parenchymal enhancement may be present in the inflammatory areas (Fig. 6) (Fig. 7). However,
lack of enhancement is also possible (Fig. 8).
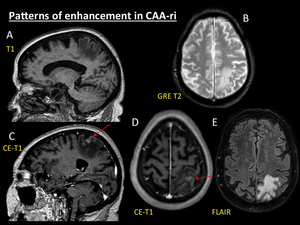
Fig. 6: Patterns of enhancement in CAA-ri. Demented 76-year-old woman with AD. MRI was performed after first epileptic seizure. MRI demonstrates a parietal area of vasogenic oedema with moderate mass effect (E) arising in previous cortical and cortical-subcortical microbleeds (B). After contrast administration, T1 reconstructions(C, D) shows ill-defined areas of cortical linear enhancement (red arrows).
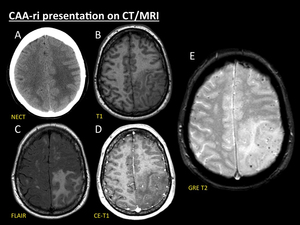
Fig. 7: CAA-ri presentation on CT/MRI. 60-year-old woman with headache, focal neurological signs and seizures. Axial NECT (A) performed at ER revealed a striking left fronto-parietal area of vasogenic oedema, thus leading to the suspicion of tumoral brain involvement. Two days later MRI scan (B, C, D and E) demonstrated that vasogenic oedema was selectively arising in areas of previous cortical and cortical-subcortical microbleeds depicted on T2-GRE sequence (E). Note that the distribution of the parenchymal oedema spares cortex (B, C). Tiny blurred foci of both cortical and sulcal enhancement are seen on contrast-enhanced-T1 sequence (D) in the involved areas.
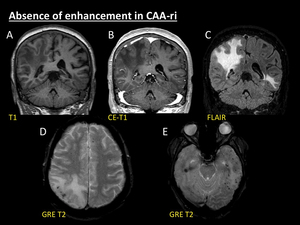
Fig. 8: Absence of enhancement in CAA-ri. 69-year-old woman with subacute declination of mental status and seizures. Coronal non-enhanced T1 (A), enhanced-T1 (B) and fat-suppressed FLAIR (C) reconstructions show areas of vasogenic oedema in right parieto-occipital and left temporal regions. Note the lack of intra- or extraaxial enhancement after contrast administration (B). Multiple cortical and cortical-subcortical microbleeds are seen on axial GRE T2 images (D, E), selectively forming clusters in the same areas where vasogenic oedema arises (C).
● Additional diffuse lobar microbleeds without oedema and ICH sequels following the typical distribution of CAA (Fig. 9).
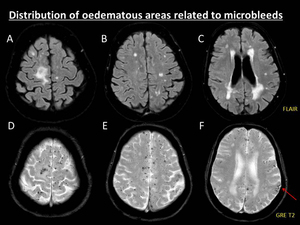
Fig. 9: Distribution of oedematous areas related to microbleeds. 76-year-old man suffering of accelerated cognitive decline and seizures secondary to CAA-ri. MRI scan demonstrated several punctate microbleeds in cortical and cortical-subcortical areas of both hemispheres on GRE T2 sequence (D, E, F). Despite the widespread distribution of the microbleeds, oedematous white matter involvement is only seen in the right upper frontal gyrus on fat-suppressed FLAIR sequence (A). Note the presence of other typical features of CAA: multiple symmetrical confluent white matter hyperintensities without mass effect of presumed vascular origin (A, B, C), and left parietal superficial siderosis (red arrow, F).
The differential diagnosis should include the following conditions:
● Typically,
in the classic form of CAA there are no areas of vasogenic oedema.
Nevertheless,
symmetrical bilateral patchy or confluent T2/FLAIR hyperintensities without mass effect of presumed vascular origin are one of the most typical finding in CAA (Fig. 1) [4].
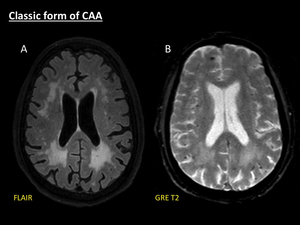
Fig. 1: Classic form of CAA. Axial fat-suppressed FLAIR (A) shows patchy symmetrical white matter hyperintensities without mass effect, with periventricular confluence, related to Fazekas 3 leukoencephalopathy. Axial GRE T2 (B) demonstrates several microbleeds manifested as multiple punctate hypointensities located in cortical and cortical-subcortical areas.
● Hypertension is the most common cause of spontaneous macro- and microbleeds in adults.
The most frequent locations of haemorrhages in chronic hypertensive microangiopathy are basal ganglia,
thalamus,
brainstem and cerebellum,
and they tend to spare cortical and cortical-subcortical areas (Fig. 10) [10].
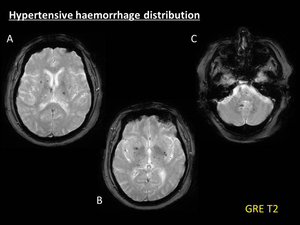
Fig. 10: Hypertensive haemorrhage distribution. Example of the typical distribution of haemorrhages in chronic hypertensive vasculopathy. Multiple punctate microbleeds, manifested as hypointense foci on GRE T2 (A, B, C), are depicted involving basal ganglia, thalamus, brainstem and cerebellum. Note the relative spare of cortical and cortical-subcortical areas, thus leading to distinguish hipertensive angiopathy from CAA brain involvement.
● Posterior reversible encephalopathy syndrome (PRES) is a neurotoxic state recognized in the setting of a number of complex conditions.
PRES is characterized by the presence of areas of vasogenic oedema,
that tend to symmetrically involve subcortical white matter (most frequently the parietal,
temporal and occipital lobes) with a pattern of distribution resembling the brain watershed zones.
Ischemia and haemorrhage are less common findings in PRES (<20%),
which tend to occur as complication in the most severe forms of the condition,
rather than being a primary cause of vasogenic oedema,
as it occurs in CAA-ri (Fig. 11) [11,
12].
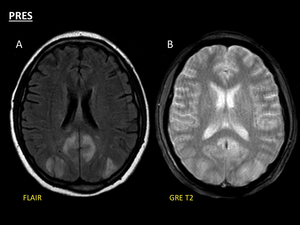
Fig. 11: Example of PRES in 53-year-old man with hypertensive crisis. Axial FLAIR (A) reveals symmetrical, bilateral and predominantly posterior hyperintense areas of vasogenic oedema (A), not associated to previous haemorrhage on axial GRE T2 (B). Note the presence of oedema affecting the posterior brain watershed areas (A). Nevertheless, haemorrhagic involvement may be seen as a complication of the clinical picture in severe forms of the condition, arising on the previous areas of parenchymal oedema, not the other way round.
● Central nervous system vasculitides (CNSV) represent a heterogeneous group of inflammatory diseases affecting the walls of blood vessels.
The radiological findings for CNSV are usually variable and nonspecific,
but ischemic infarcts are the most common type of brain involvement.
Both macro- and microhaemorrhages may also be present.
Occasionally,
vasogenic oedema may be seen but they do not selectively arise in areas of previous bleeding (Fig. 12) [13].
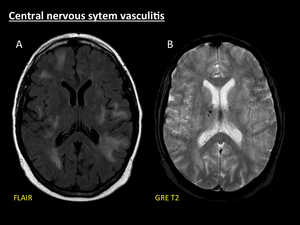
Fig. 12: Central nervous system vasculitis. Example of brain involvement in a 47-year-old woman with biopsy-proven primary central nervous system vasculitis (PCNSV). Multiple patchy asymmetrical areas of parenchymal swelling are seen on FLAIR (A). No signs of previous haemorrhage are demonstrated in these areas on GRE T2 (B). Note the presence of haemorrhagic foci in the right thalamus (B).
● Haemorrhagic intracranial metastases may cause areas of vasogenic oedema arising in metastatic lesions which also show signs of previous bleeding manifested as T2*/SWI hypointensities.
The clinical context and the presence of intraxial enhancing parenchymal lesions help to make the differential diagnosis (Fig. 13) [14].
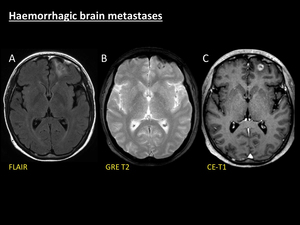
Fig. 13: Haemorrhagic brain metastases. Example of presentation of haemorrhagic brain metastases in a 53-year-old man with small-cells lung cancer. A left frontal area of vasogenic oedema is seen on FLAIR (A) with effaced adjacent sulci and mild mass effect to the frontal horn of the left lateral ventricle. Axial T1 sequence after gadolinium administration (C) shows a cortical-subcortical enhancing nodule suggestive of parenchymal metastasis which is responsible for the local swelling. Note the hypointense peripheral rim of this nodule on GRE T2 (B) related to intralesional haemorrhage.
The gold standard to confirm a CAA-ri is a cerebral biopsy.
Chung et al.
(Table 2) proposed diagnostic criteria to assess the probability of CAA-ri based on neuroimaging,
leading to the possibility of establishing the diagnosis without biopsy [5].
The prognosis of CAA-ri without treatment is usually very poor,
highlighting the importance of early diagnosis based on imaging.
A significant proportion of patients respond to intensive high-dose corticosteroid treatment with initial bolus of 1 g/day for 3 days and then 1 mg/kg/day,
that should be tapered off gradually over few months [6].
Radiological findings tend to disappear within weeks after beginning the treatment and this signifies an improved clinical outcome (Fig. 14) (Fig. 15),
nonetheless in many cases,
severe disability may occur.
There have also been described some cases with spontaneous self-resolution without corticosteroid therapy [6,
7].
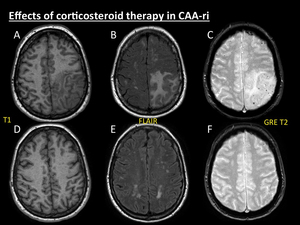
Fig. 14: Effects of corticosteroid therapy in CAA-ri. Same patient as in Fig. 9. Image series (T1, FLAIR and GRE T2) at time of diagnosis (A, B, C) and 6 months after the beginning of the corticosteroid therapy (D, E, F) show complete resolution of the previous areas of vasogenic oedema and its secondary mass effect.
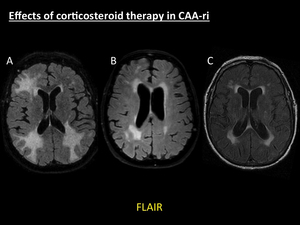
Fig. 15: Effects of corticosteroid therapy in CAA-ri. Same patient as in Fig. 6. Axial fat-suppressed FLAIR at the time of diagnosis of CAA-ri (A), axial fat-suppressed FLAIR one month after the beginning of the therapy (B), and axial FLAIR one year after the onset of acute symptoms (C) demonstrate the progressive resolution of the initial asymmetrical areas of parenchymal swelling with proper treatment. Note the persisting symmetrical areas of white matter hyperintensity in (C), related to microangiopathy.

 showed right parietal subgaleal and soft tissue haematoma without intracranial complications. One year later the patient complained of progressive headache and rapid mental deterioration. New NECT (B) at ER was then performed demonstrating left upper parietal white matter hypodensity with subtle effaced sulci. In the next days the condition of the patient rapidly aggravated, thereby resulting in hospitalization. Next NECT (C), five days after (B), demonstrated marked left parietal white matter hypodensity with increasing mass effect (C) suggestive of vasogenic oedema.")
 shows a right parieto-occipital geographical area of white matter hypodensity that spares cortex with effaced sulci and mass effect collapsing atrium and occipital horn of right lateral ventricle, suggestive of vasogenic oedema. A CECT (B) was performed to rule out an enhancing tumour responsible for the vasogenic oedema. No enhancing intra- or extraaxial lesions were seen. In this cases MRI is mandatory to further investigate the cause of parenchymal oedema.")
 demonstrates three areas of white matter hyperintensity with effaced sulci. GRE T2 (B) shows multiple punctate cortical and cortical-subcortical hypointensities, related to microbleeds, selectively distributed in the same areas of vasogenic oedema.")
 reveals multiple punctate cortical and cortical-subcortical microbleeds in both hemispheres. On TSE T2 sequence (B) a huge area of right parieto-occipital white matter hyperintensity is seen, sparing the cortex, depicting vasogenic oedema. Note the perfect correlation to the distribution of the parenchymal hypodensity seen on NECT. This area of oedematous involvement shows high signal intensity on both b-1000 DWI (C) and ADC map (D), therefore confirming that hyperintensity on DWI is due to T2 shine-trough phenomenon.")
 arising in previous cortical and cortical-subcortical microbleeds (B). After contrast administration, T1 reconstructions(C, D) shows ill-defined areas of cortical linear enhancement (red arrows).")
 performed at ER revealed a striking left fronto-parietal area of vasogenic oedema, thus leading to the suspicion of tumoral brain involvement. Two days later MRI scan (B, C, D and E) demonstrated that vasogenic oedema was selectively arising in areas of previous cortical and cortical-subcortical microbleeds depicted on T2-GRE sequence (E). Note that the distribution of the parenchymal oedema spares cortex (B, C). Tiny blurred foci of both cortical and sulcal enhancement are seen on contrast-enhanced-T1 sequence (D) in the involved areas.")
, enhanced-T1 (B) and fat-suppressed FLAIR (C) reconstructions show areas of vasogenic oedema in right parieto-occipital and left temporal regions. Note the lack of intra- or extraaxial enhancement after contrast administration (B). Multiple cortical and cortical-subcortical microbleeds are seen on axial GRE T2 images (D, E), selectively forming clusters in the same areas where vasogenic oedema arises (C).")
. Despite the widespread distribution of the microbleeds, oedematous white matter involvement is only seen in the right upper frontal gyrus on fat-suppressed FLAIR sequence (A). Note the presence of other typical features of CAA: multiple symmetrical confluent white matter hyperintensities without mass effect of presumed vascular origin (A, B, C), and left parietal superficial siderosis (red arrow, F).")
 shows patchy symmetrical white matter hyperintensities without mass effect, with periventricular confluence, related to Fazekas 3 leukoencephalopathy. Axial GRE T2 (B) demonstrates several microbleeds manifested as multiple punctate hypointensities located in cortical and cortical-subcortical areas.")
, are depicted involving basal ganglia, thalamus, brainstem and cerebellum. Note the relative spare of cortical and cortical-subcortical areas, thus leading to distinguish hipertensive angiopathy from CAA brain involvement.")
 reveals symmetrical, bilateral and predominantly posterior hyperintense areas of vasogenic oedema (A), not associated to previous haemorrhage on axial GRE T2 (B). Note the presence of oedema affecting the posterior brain watershed areas (A). Nevertheless, haemorrhagic involvement may be seen as a complication of the clinical picture in severe forms of the condition, arising on the previous areas of parenchymal oedema, not the other way round.")
. Multiple patchy asymmetrical areas of parenchymal swelling are seen on FLAIR (A). No signs of previous haemorrhage are demonstrated in these areas on GRE T2 (B). Note the presence of haemorrhagic foci in the right thalamus (B).")
 with effaced adjacent sulci and mild mass effect to the frontal horn of the left lateral ventricle. Axial T1 sequence after gadolinium administration (C) shows a cortical-subcortical enhancing nodule suggestive of parenchymal metastasis which is responsible for the local swelling. Note the hypointense peripheral rim of this nodule on GRE T2 (B) related to intralesional haemorrhage.")
:20–6.")
 at time of diagnosis (A, B, C) and 6 months after the beginning of the corticosteroid therapy (D, E, F) show complete resolution of the previous areas of vasogenic oedema and its secondary mass effect.")
, axial fat-suppressed FLAIR one month after the beginning of the therapy (B), and axial FLAIR one year after the onset of acute symptoms (C) demonstrate the progressive resolution of the initial asymmetrical areas of parenchymal swelling with proper treatment. Note the persisting symmetrical areas of white matter hyperintensity in (C), related to microangiopathy.")