ECR 2019 / C-0185

Neurooncology pending battles: is it possible to differentiate true progression from pseudoprogression?
Congress:
ECR 2019
Poster Number:
C-0185
Type:
Educational Exhibit
Keywords:
Neoplasia, Multidisciplinary cancer care, Radiation effects, Diagnostic procedure, MR-Diffusion/Perfusion, MR, Neuroradiology brain
Authors:
A. Hilario Barrio, P. Martín Medina, E. Salvador, G. Ayala, L. Koren, A. Martinez de Aragon, F. Ballenilla, J. M. Millan, A. Ramos Gonzalez; Madrid/ES
DOI:
10.26044/ecr2019/C-0185

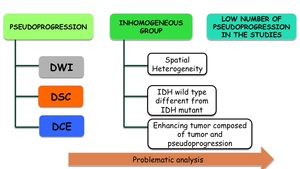
Fig. 10:
Problematic analysis of pseudoprogressions

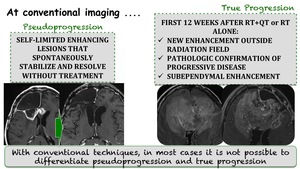
Fig. 11:
At conventional imaging

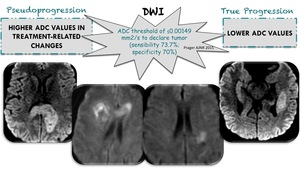
Fig. 12:
DWI differentiating pseudoprogression and true progression

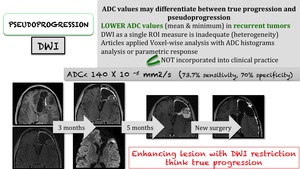
Fig. 13:
New enhancing lesion with DWI restriction ... think true progression

Fig. 14:
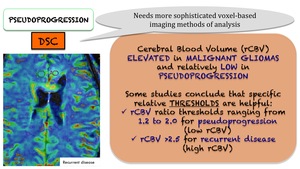
rCBV threshold values for pseudoprogression and recurrent disease

Fig. 15:
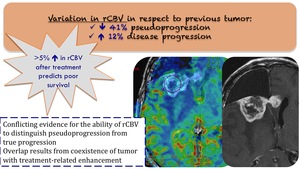
Variations of rCBV in respecto to previous tumor

Fig. 16:
Importance of rCBV distinguishing pseudoprogression and true progression

Fig. 17:
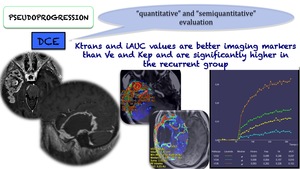
Ktrans and iAUC relatively higher in recurrent tumors

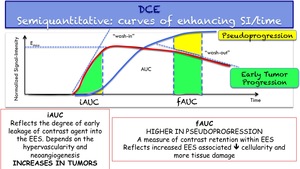
Fig. 18:
Semiquantitative analysis: curves of enhancing SI/time

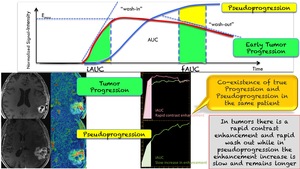
Fig. 19:
Different curves of enhancing SI/time in pseudoprogression and recurrent disease