Women of BOT group had: curves of type I and in 66.7% (10 cases) (Fig.
3),
type II - 28.6% (5 patients),
type III - 4.8% (1 case).
At the group with MOT 75.6% (23 cases) (Fig.
4) had type III and 24.4% (11) - type II curves.
There was not TIC of type I in patients with MOT.
In our study 5 patients with borderline tumors obtained type II of TIC (Fig.
5),
but those tumors were excluded from our studybecause of limited numbers of patients.
In control group (with normal ovaries) were identified 6 patients with TIC of the type I (Fig.6) but typically normal ovaries had no additional contrast enhanced in compare with myometrium.
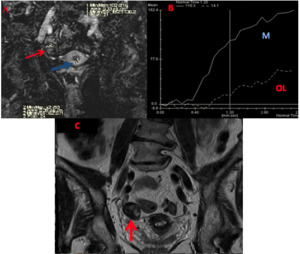
Fig. 3: A 36-year-old woman with ovarian fibrothecoma. On DCE-MRI (A), OT solid mass (red arrow) enhanced with a curve type I (B - OL) in compare with myometrial tissue (blue arrow). Continuous line curve represents normal myometrial enhancement (B - M). Coronal T2WI (C) demonstrated a right-side ovarian solid mass (red arrow).
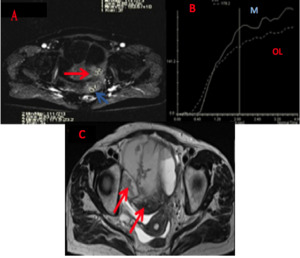
Fig. 4: A 54-year-old woman with ovarian serous adenocarcinoma. On DCE-MRI (A) the solid component of ovarian lesions (red arrow) in compare with myometrium tissue (blue arrow) showed a obvious contrast enhancement compared (B - OL) with the myometrium (B - M). The solid component of ovarian lesions shows a curve type III. Axial T2WI (C) demonstrated ovarian lesions with cystic solid structure (red arrows).
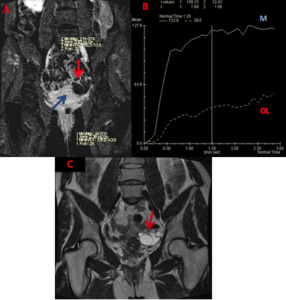
Fig. 5: A 48-year-old woman with serous borderline cystadenoma. On DCE-MRI (A) the solid tissue (red arrow) in compare with myometrium tissue (blue arrow) enhanced with a curve type II (B - OL). Continuous line curve represents myometrial enhancement (B - M). Coronal T2WI (C) demonstrated multilocular cystic ovarian lesion with thickened irregular septa (red arrow).
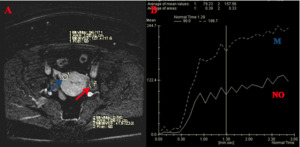
Fig. 6: A 39-year-old woman with normal ovaries (NO) which show a curve type I (B). On DCE-MRI (A) the normal ovaries (red arrow) in compare with myometrium tissue (blue arrow) showed a mild contrast enhancement (B - NO) compared with the myometrium (B - M).
The results of DCE-MRI according to the histologic findings are shown at the Table.
3.
The significant differences in all 4 analyzed semi-quantitative parameters (EA,
MS,
THR and IAUC60ratios) of TIC were found between the group of BOT+normal ovaries and the MOT group as well as between BOT and MOT groups (p<0,05).
A difference of analyzed parameters at the BOT group and the group with normal ovaries wasn't statistically significant.
The mean value of EA rate in BOT,
MOT and “normal ovaries” groups were 0.47,
0.76 and 0.50,
respectively.
A statistically significant difference was found between BOT and MOT for EA ratio,
but there was not statistically significant difference between BOT and normal ovaries (Table 3).
The difference in the IAUC60 was found between BOT+normal ovaries and the MOT (p<0.001).
The IAUC60 ratio was higher for MOT than for BOT (p<0.0003) (Fig.
7).
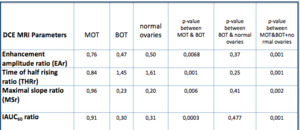
Table 3: The comparison of DCE MRI semi-quantitative parameters between BOT, BOT and Normal Ovaries.
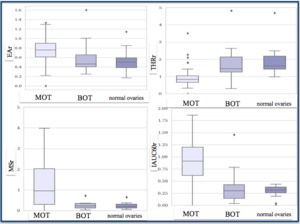
Fig. 7: Data are presented as box-plot-and-whisker diagrams. The box represents the values from the lower to upper quartile. The central line represents the median. The whiskers extend from the minimum to the maximal value, excluding extreme values (outliers). Each tumor is represented by a point.
The results of ROC analysis of all DCE-MRI parameters are summarized at the Table.
4. The IAUC60ratio was the most important factor among analyzed TIC parameters for BOT and MOT differentiation.
The IAUC60ratio less than 0.5 was defined for BOT and more than 0.5 was defined for MOT,
withthesensitivity and specificity of 82% and 91%,
respectively (Fig.
8).
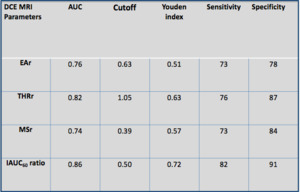
Table 4: Results of ROC Analysis of DCE MRI semi-quantitative parameters
The IAUC60ratio was the most important factor among analyzed TIC parameters for BOT and MOT differentiation.
The IAUC60ratio less than 0.5 was defined for BOT and more than 0.5 was defined for MOT,
with a sensitivity and specificity of 82% and 91%,
respectively (Fig.
8).
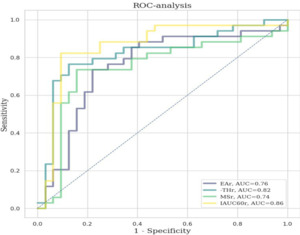
Fig. 8: ROC curves for EA, MS, THR and IAUC60 ratios for discrimination of benign from malignant ovarian tumors.
Angiogenesis is the process of formation of new blood vessels from preexisting blood vessels,
which is the fundament of tumor growth,
progression,
invasion,
and metastasis spreading for about all types of tumors.
Malignant tumors were generally hypervascular with immature and fragile tumor vessels,
which could increase the vascular permeability,
whereas hypovascularity was important characteristic of benign tumors [7].
Malignant tumors were generally hypervascular with immature and fragile tumor vesselswhich could increase the vascular permeability,
whereas hypovascularity was characteristic of benign tumors with integrally morphological and functional vessels [8].
DCE-MRI could make qualitative,
semi-quantitativeand quantitative evaluation of blood perfusion in ovarian tumors based on the different enhancement pattern.
DCE-MRI is widely acknowledged to be useful in characterizing ovarian tumors.
Analyzing of TIC type was already widely used in some clinical settings,
particularly in differentiating malignant tumors from benign tumors in breast and prostate carcinoma [9].
Our study demonstrated that DCE-MRI is the dominant modality in differentiation BOT and MOT.
Indeed,
classification of the TIC of tumor enhancement into three types correlated with the histologic findings.
Consequently,
the main part of the MOT displayed TIC of the type III and BOT displayed TIC of the type I.
However,
in our study the TIC couldn’t differentiate BOT from normal ovaries,
because some normal ovaries had type I of TIC or it usually no additional contrast enhanced in compare with myometrium.
The value of EA represented the amount of contrast agent in the tumor vessels.
In theory,
the EA has to be higher in malignant tumors than in borderline tumors and it has to be higher in borderline tumors than in benign tumors,
which was confirmed by several studies [6.10.11].
In our study (Fig.
7),
among the three parameters of DCE-MRI thus obtained (EAr,
THRr,
and MSr),
the EA ratio was the most relevant criterion for distinguishing benign and malignant ovarian tumors.
The median EA ratio of MOT was above than in BOT and normal ovaries (0,76,
0,47 and 0,50 p<0,001).
Initial area under the curve (IAUC) parameter has the advantage of easy calculation,
robust,
and reasonably reproducible,
because it is not involved in a fitting process.
Thomassin-Naggara & colleagues (2008) showed that IAUC60ratio below 0.25 was highly suggestive of BOT,
while an IAUC60ratio above 0.39 was highly suggestive of an invasive tumor [6].
The results of ROC analysis in our examination (Fig.
8) demonstrated that IAUC60ratio below 0.5 was specified for BOT and above 0.5 for MOT with highly sensitivity and specificity of 82% and 91%,
respectively.
This parameter clearly distinguished the BOT from MOT.
