Keywords:
Neoplasia, Imaging sequences, Computer Applications-General, MR, Neuroradiology brain, MR physics, Molecular imaging
Authors:
A. Deshmane1, M. Zaiss1, K. Herz1, M. Rivlin2, A. Kujawa3, M. Kim3, G. Navon2, X. Golay3, K. Scheffler1; 1Tuebingen/DE, 2Tel Aviv/IL, 3London/UK
DOI:
10.26044/ecr2019/C-1311
Results
All three sites produced similar CEST contrasts with stable signal distribution over all slices.
APT-weighted images exhibited the expected low contrast in healthy tissues (Figure 2).
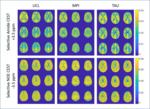
Spectrally selective amide- and NOE-CEST maps (Figure 3) showed gray- and white-matter contrast comparable to that reported previously at ultra-high field [25].
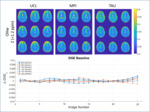
Negligible change in OH-weighted contrast (Figure 4) indicated a stable baseline for future dynamic glucose injection measurements in patients.
The 3 T snapshot CEST protocol generates expected protein CEST contrast signature in the brain tumor (Figure 5): hyperintensity on APTw imaging and elevated selective amide CEST signal corresponding to the Gadolinium enhancing region,
and depleted selective NOE CEST signal in the necrotic region.
Detailed analysis of OH-weighted spin-lock CEST contrast in brain tumor patients can be found in the presentation of Dr.
Tobias Lindig et al at ECR 2019 [26].


