ECR 2019 / C-1585
Evaluation of salivary glands by imaging methods: correlated with SIALO-MR
Congress:
ECR 2019
Poster Number:
C-1585
Type:
Educational Exhibit
Keywords:
Inflammation, Calcifications / Calculi, Technical aspects, Sialography, CT, MR, Digital radiography, Salivary glands, Head and neck, Swallowing disorders
Authors:
E. C. Raimundo1, M. F. P. Pereira1, M. D. S. Guedes1, L. D. P. G. D. Farias2, I. C. Queiroz1, R. H. Q. Ferreira1, I. S. Faé1, D. C. Menezes1, T. S. D. Sales1; 1São Paulo/BR, 2São Paulo, SP/BR
DOI:
10.26044/ecr2019/C-1585
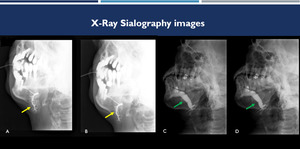
: sialography images demonstrate submandibular duct and its branches with increased caliber and irregular path, in a patient with inflammatory process (yellow arrows).(C-D): sialography images demonstrate parotid ducts with increased caliber, without appreciable evidence of filling failure images, in another patient with chronic sialoadenitis (green arrows).
References: Hospital Alvorada, Americas Serviços Médicos, São Paulo / Brazil")
Fig. 1:
(A-B): sialography images demonstrate submandibular duct and its branches with...
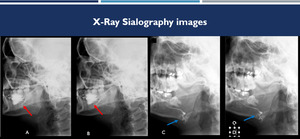
: sialography images demonstrate the main parotid duct and its branches with reduced caliber and irregular contours, with small saccular sialoectasias in the terminal branches (red arrows). (C-D): another patient, sialography images demonstrate increased right posterior submandibular ductus of caliber (blue arrows).
References: Hospital Alvorada, Americas Serviços Médicos, São Paulo / Brazil")
Fig. 2:
(A-B): sialography images demonstrate the main parotid duct and its branches...
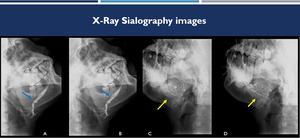
:sialography images show increased caliber of the submandibular duct and its branches, highlighting the image of filling failure compatible with sialolith (blue arrows). (C-D): sialography images demonstrate parotid duct and its usual caliber and trajectory with canaliculi dilatations in another patient with chronic sialoadenitis (yellow arrows).
References: Hospital Alvorada, Americas Serviços Médicos, São Paulo / Brazil")
Fig. 3:
(A-B):sialography images show increased caliber of the submandibular duct and...
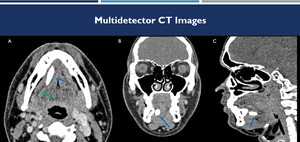
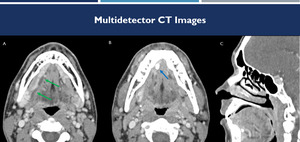
: soft-tissue window CT images on axial (A), coronal (B) and sagittal (C) demonstrates a calculus inside the right submandibular duct (blue arrows), with upstream ductal ectasia (green arrow).
References: Hospital Alvorada, Americas Serviços Médicos, São Paulo / Brazil")
Fig. 4:
(A-C): soft-tissue window CT images on axial (A), coronal (B) and sagittal (C)...
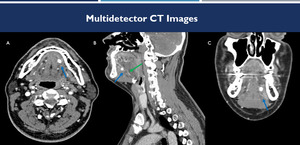
: contrast-enhanced CT images on axial (A-B) and sagittal (C) demonstrate dilatation of the submandibular duct (green arrows), with calculus at its distal extremity (blue arrow).
References: Hospital Alvorada, Americas Serviços Médicos, São Paulo / Brazil")
Fig. 5:
(A-C): contrast-enhanced CT images on axial (A-B) and sagittal (C) demonstrate...
: contrast-enhanced CT images on axial (A), sagittal (B) and coronal (C) in a sialolithiasis case. There is a calculus inside the left submandibular duct (Wharton duct) (blue arrow), with upstream ductal ectasia (green arrow).
References: Hospital Alvorada, Americas Serviços Médicos, São Paulo / Brazil")
Fig. 6:
(A-C): contrast-enhanced CT images on axial (A), sagittal (B) and coronal (C)...
 demonstrates right submandibular intraductal filling failure (green arrow). Contrast-enhanced CT image (B) demonstrates the sialolith (blue arrow).
References: Hospital Alvorada, Americas Serviços Médicos, São Paulo / Brazil")
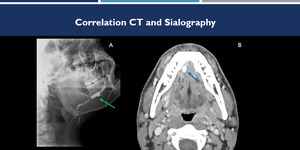
Fig. 7:
Correlation between sialography and CT images. Sialography (A) demonstrates...
 and after administration of sialagogue (C), demonstrate the increasing quality of the study after using of sialogogo. References: Hospital Alvorada, Americas Serviços Médicos, São Paulo / Brazil")
Fig. 8:
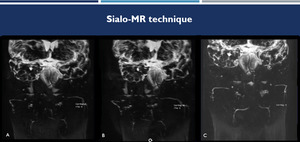
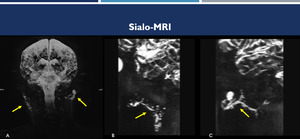
Sialo-MR technique. Coronal sialo-MRI before (A and B) and after administration...
 and sagittal (B-C) planes demonstrate a case of bilateral sialoadenitis (Sjogren's syndrome) (yellow arrows).
References: Hospital Alvorada, Americas Serviços Médicos, São Paulo / Brazil")
Fig. 9:
Sialo MRI. Coronal (A) and sagittal (B-C) planes demonstrate a case of...
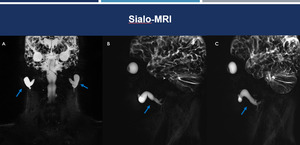
, left sagittal (B) and right sagittal (C) planes show dilatation of their main parotid ducts (Stenon ducts) to the anterior margin of the masseter (blue arrows).
References: Hospital Alvorada, Americas Serviços Médicos, São Paulo / Brazil")
Fig. 10:
Sialo-MRI. 3D-MIP reconstruction in coronal (A), left sagittal (B) and right...
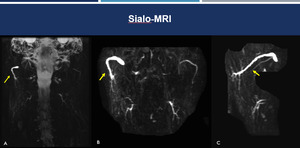
 and sagittal (C) planes demonstrate dilatation of the right parotid duct and discreet ectasia of the submandibular ducts (yellow arrows).
References: Hospital Alvorada, Americas Serviços Médicos, São Paulo / Brazil")
Fig. 11:
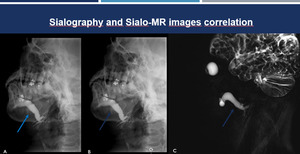
Sialo-MRI. 3D-MIP reconstructions in the coronal (A and B) and sagittal (C)...
 and sialo-MRI (C) of the same patient with ductal dilatation demonstrate an excellent correlation between the two methods (blue arrows).
References: Hospital Alvorada, Americas Serviços Médicos, São Paulo / Brazil")
Fig. 12:
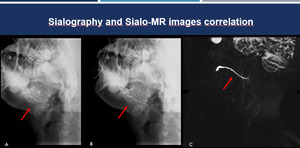
Sialography and Sialo-MRI correlation. Sialography (A-B) and sialo-MRI (C) of...
 and Sialo-MR (C) images of the same patient. Correlation between the two methods in the evaluation of dilatation of the parotid ducts and secondary branches (red arrows).
References: Hospital Alvorada, Americas Serviços Médicos, São Paulo / Brazil")
Fig. 13:
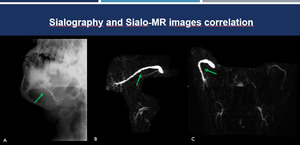
Sialography and Sialo-MRI correlation. Sialography (A-B) and Sialo-MR (C)...
 and Sialo-MR (B-C). Correlation between the two methods in the evaluation of dilatation of the submandibular and parotid right ducts (green arrows).
References: Hospital Alvorada, Americas Serviços Médicos, São Paulo / Brazil")
Fig. 14:
Sialography and Sialo-MRI correlation. Sialography (A) and Sialo-MR (B-C)....
 and coronal (B) planes in a patient with Sjogren's syndrome demonstrate obstructive sialolithiasis with sialoectasia (blue arrow). T2-weighted MRI with fat saturation on axial (C) and coronal (D) planes demonstrate a good correlation between the methods (red arrow).
References: Hospital Alvorada, Americas Serviços Médicos, São Paulo / Brazil")
Fig. 15:
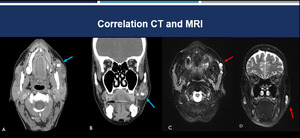
Correlation between CT and MRI. Contrast-enhanced CT images on axial (A) and...
: T2-weighted MRI with fat saturation; (B): ADC MRI; (C): Sialo-MRI. Note the well-delimited oval image with slight hypersignal in T2 and slight hypossignal on ADC (suggesting increase cellularity), adjacent to the right mandibular branch (red arrows). The Association of these images with Sialo-MR allowed us to remove the hypothesis of intra-parotid lesion. The case was subsequently confirmed as masseter muscle sarcoma.
References: Hospital Alvorada, Americas Serviços Médicos, São Paulo / Brazil")
Fig. 16:
(A): T2-weighted MRI with fat saturation; (B): ADC MRI; (C): Sialo-MRI. Note...