ECR 2019 / C-1658
Applications of Magnetic Resonance Imaging in the evaluation of acute abdominal pain
Congress:
ECR 2019
Poster Number:
C-1658
Type:
Educational Exhibit
Keywords:
Abdomen, Emergency, MR, MR-Cholangiography, Cholangiography, Acute, Infection, Inflammation
Authors:
M. F. P. Pereira, L. D. P. G. D. Farias, D. C. Menezes, R. H. Q. Ferreira, M. D. O. M. Hans, E. C. Raimundo, P. G. Santana, M. D. S. Guedes, M. V. Galon; São Paulo/BR
DOI:
10.26044/ecr2019/C-1658
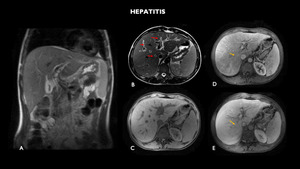
 shows liver of slightly enlarged dimensions, associated with diffuse periportal edema (red arrow) and associated perfusion disorder (yellow arrow).
References: Hospital Alvorada/ Americas Serviços Médicos, São Paulo / Brazil")
Fig. 1:
MRI (A – coronal T2, B – axial T2, C – axial before, D- axial arteriosus...
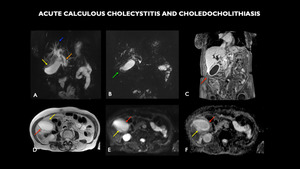
 shows distended gallbladder with diffuse parietal thickening (red arrows) and with small calculi / deposited biliary mud (green arrow). Diffuse perivesicular edema (yellow arrows) is associated. Moderate diffuse dilation of the bile ducts to the plane of the papilla (blue arrow). An elongated calculus measuring 4.0 x 1.5 mm is observed in the middle third of the common bile duct, 3.2 cm apart from the papilla (orange arrow). Diffuse parietal enhancement of the bile ducts is associated with enhancement heterogeneity in the periphery of the right hepatic lobe, inferring inflammatory component associated.
References: Hospital Alvorada/ Americas Serviços Médicos, São Paulo / Brazil")
Fig. 2:
MRI (A – coronal 3D, B – Magnetic Resonance Cholangiopancreatography -...
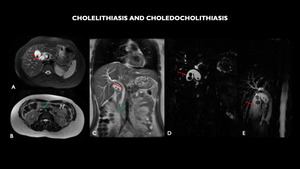
, shows multiple calculi in the gallbladder (red arrow) and filling failure in the plane of the duodenal papilla, corresponding to micro calculi (green arrow). Choledochal dilated with calculus in its interior. Cholangioresonance (D and E). Multiple calculi in the gallbladder.
References: Hospital Alvorada/ Americas Serviços Médicos, São Paulo / Brazil")
Fig. 3:
MRI (A – axial T2 with fat-sat, B – axial T2, C – coronal T2), shows...
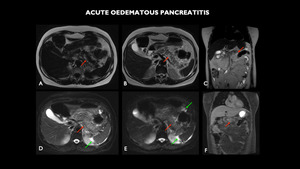
 shows the enlarged pancreas, with loss of usual acinar lobulated contours, with marked parenchymal edema (red arrows). It is associated with a change in the sign of the peripancreatic adipose plane, with a moderate amount of fluid that extends to the gastroesplenic space and to the flanks through the anterior pararenal and lateral canals (green arrows). Post-contrast enhancement areas are not characterized.
References: Hospital Alvorada/ Americas Serviços Médicos, São Paulo / Brazil")
Fig. 4:
MRI (A – axial T1 dixon F, B – axial T2, C – coronal T2, D – axial T2...
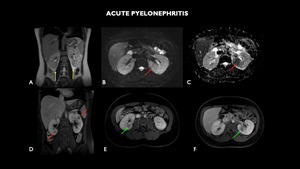
 shows undefined areas of signal change sparse in the bilateral renal parenchyma, more numerous and larger on the left (red arrows). They are characterized by tenuous hypersignal foci in T2 interspersed with low-signal focus, showing heterogeneous contrast enhancement, with predominance of hypo-contrast, configuring the appearance of striated nephrogram (green arrows). Signal alteration of the perinephric fatplane is associated with a small amount of fluid, larger on the left, and thickening of the pararenal fascia (yellow arrows).
References: Hospital Alvorada/ Americas Serviços Médicos, São Paulo / Brazil")
Fig. 5:
MRI (A – coronal T2, B – axial diffusion-weighted imaging - DWI, C –...
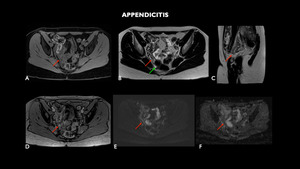
 shows cecal appendix of posterior and medial tract, located in the pelvic excavation, with a slightly enlarged diameter (0.9 cm) and parietal post-contrast enhancement and certain blurring of adjacent adipose planes, findings compatible with acute appendicitis (red arrows). There are no organized collections, evidencing only small amount of free fluid in the pelvis.
References: Hospital Alvorada/ Americas Serviços Médicos, São Paulo / Brazil")
Fig. 6:
MRI (A – axial T1 with fat-sat, B – axial T2, C – sagittal T2, D –...
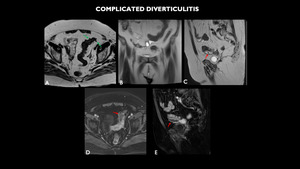
 shows diverticulum sparse in sigmoid (green arrow), associated with mild regular parietal thickening of this intestinal segment, with small collection adjacent to the lower contour of this, with gaseous foci of permeation (red arrow).
References: Hospital Alvorada/ Americas Serviços Médicos, São Paulo / Brazil")
Fig. 7:
MRI (A – axial T2, B – coronal T2, C – sagittal T2, D – axial post...
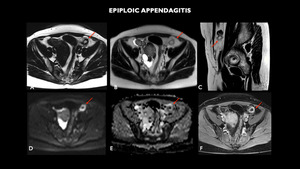
 shows nodule with fat attenuation measuring 1.7 cm on the antimesenteric border of the sigmoid / descending colon transition with peripheral enhancement, associated with the densification of local adipose planes, compatible with epiploic appendagitis.
References: Hospital Alvorada/ Americas Serviços Médicos, São Paulo / Brazil")
Fig. 8:
MRI (A – axial T1, B – axial T2, C- sagittal T2, D- axial...
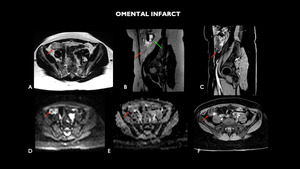
 shows densification of the fat with diffusion restriction on the antimesenteric face in the right iliac fossa, inferring omental infarction (red arrows). Adnexial formation left, suggestive of chronic hematosalpinx (green arrow).
References: Hospital Alvorada/ Americas Serviços Médicos, São Paulo / Brazil")
Fig. 9:
MRI (A – axial T1, B – sagittal T2, C- sagittal T1 post contrast, D- axial...
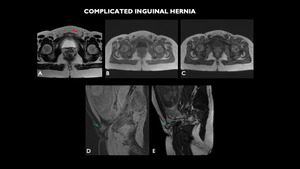
 shows enlargement of the left inguinal canal (red arrow), with dislocation of intestinal portion and mesentery, which does not suffer significant alterations to the Valsalva maneuver (green arrow).
References: Hospital Alvorada/ Americas Serviços Médicos, São Paulo / Brazil")
Fig. 10:
MRI (A – axial T2, (A – axial T2, B – axial in phase, C – axial out of...
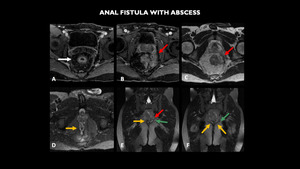
 shows left pararetal abscess (red arrow), just above the anus levator muscle (green arrow) and in close contact with it, associated with surrounding soft tissue edema and diffuse fistulae (yellow arrow), sometimes communicating, that are externalized in the gluteal fold (images not included). Note the parietal thickening of the rectum with engorgement of the straight vessels (white arrow), suggesting inflammatory disease in activity.
References: Hospital Alvorada/ Americas Serviços Médicos, São Paulo / Brazil")
Fig. 11:
MRI (A - axial T1 post contrast, B - coronal T1 post contrast, C - axial T2, D...
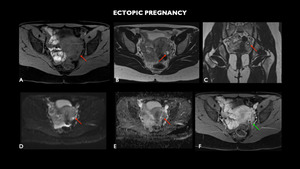
 shows small cystic formation with thick walls in the left adnexal region (red arrows), located between the medial ovarian surface and the uterine wall, measuring about 0.9 cm, showing parietal enhancement to the intravenous contrast (green arrow). This formation, although nonspecific, confirmed that it was ectopic gestation on ultrasonography.
References: Hospital Alvorada/ Americas Serviços Médicos, São Paulo / Brazil")
Fig. 12:
MRI (A – axial T1, B – axial T2, C- coronal T2, D- axial...
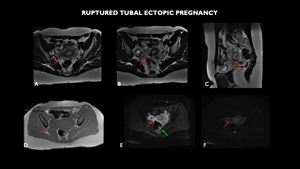
 shows in the right adnexal region, between the ovary and the uterine body, the presence of elongated nodular formation and cystic appearance, with thick and amphoraous walls, measuring 3.7 x 1.7 cm (red arrows). Fluid with a higher protein / hemorrhagic level and with hydro-air level occupying much of the pelvic excavation, compatible with hematopneumoperitoneum (green arrows).
References: Hospital Alvorada/ Americas Serviços Médicos, São Paulo / Brazil")
Fig. 13:
MRI (A and B– axial T2, C- sagittal T2, D – axial T1 in phase, E- axial...
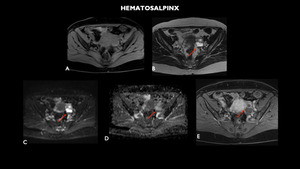
 shows tubular and sinuous formation in the left adnexal, just-ovarian region, measuring 4.4 x 2.5 cm, with a liquid content and sometimes thick, leveled formation suggestive of hematosalpinx (red arrows).
References: Hospital Alvorada/ Americas Serviços Médicos, São Paulo / Brazil")
Fig. 14:
MRI (A- axial T1, B- axial T2, C- axial diffusion-weighted imaging - DWI, D –...
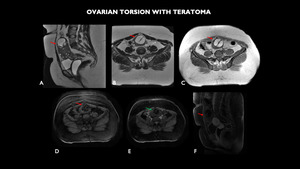
 shows expansive lesion with hypersignal T2 (red arrow). Note also the absence of post-contrast enhancement of the entire ovary, with adjacent vascular pedicle (green arrow), suggesting ovarian torsion.
References: Hospital Alvorada/ Americas Serviços Médicos, São Paulo / Brazil")
Fig. 15:
MRI (A - sagittal T2, B - axial T2, C - axial T1, D - axial T1 with fat-sat, E...
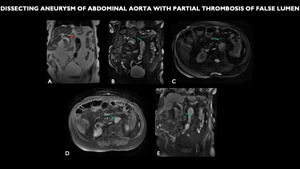
 shows diffuse abdominal ectasia, tortuous and atheromatous (red arrow) aortic aneurysm of the infrarenal aorta, with partial thrombosis of its lumen (green arrow).
References: Hospital Alvorada/ Americas Serviços Médicos, São Paulo / Brazil")
Fig. 16:
MRI (A - coronal T2, B - coronal FIESTA, C - axial FIESTA, D - axial post...
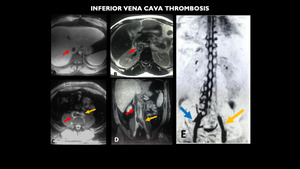
 shows inferior vena cava (red arrow) and left common iliac vein thrombosis (yellow arrow), also hepatic veins and left renal vein thrombosis (images not included). Note the extensive collateral circulation established through the vertebral plexus from the right common iliac vein (blue arrow).
References: Hospital Alvorada/ Americas Serviços Médicos, São Paulo / Brazil")
Fig. 17:
MRI (A e C – axial T1 venous, B – axial T2, D – coronal T1 venous, E –...
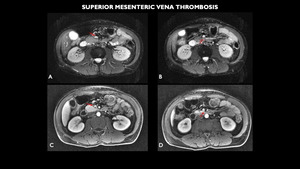
 shows small partial filling failure in the upper segment of the superior mesenteric vein (red arrows).
References: Hospital Alvorada/ Americas Serviços Médicos, São Paulo / Brazil")
Fig. 18:
MRI (A and B- axial diffusion-weighted imaging - DWI, C and D- axial T1 post...