Study population
From December 2017 to April 2018,
28 Patients older than 50 who underwent chest CT without using contrast media according to any other clinical need were prospectively enrolled,
and informed consent from participants was waived. Among these people,
we exclude 8 patients whose calcium score that is taken by calcium score CT was 0.
Finally,
the results of 20 patients were analyzed in this study.
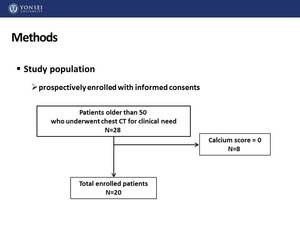
Fig. 8
CT acquisition and parameters
All CT scans were performed on a 256-slice CT scanner (Revolution,
GE healthcare,
Waukesha,
Wisconsin,
US).
Non-enhanced chest CT scans were done with 16cm-coverage axial volume scan technique and the following parameters : 120 kVp,
noise index = 20,
tube rotation time = 0.28 sec,
and slice thickness = 0.625mm,
1.25mm,
2.5mm).
Then ECG-triggered cardiac calcium scoring CT was performed with 16cm axial volume scan and the following parameters; 120 kVp,
noise index = 20,
tube rotation time = 0.28 sec,
slice thickness = 2.5mm).
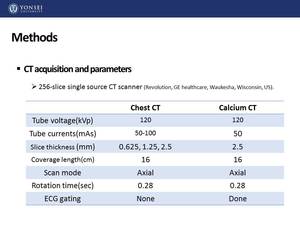
Fig. 9
Calcium score analysis
Two radiologists measured CACS using chest CT (3 slice thickness; 0.625,
1.25,
2.5mm) and protocolized calcium score CT for total 20 patients.
For calculating CACS,
we use a commercially available reconstruction program for three-dimensional (3D) reconstruction and measurement (Aquarius iNtuition TM Ver.4.4.6 TeraRecon,
Foster City,
CA,
USA).
Using the Agatston score method,
more than 130HU was defined as calcification and the semi-automated method was used to set the calcification area.
The multiplication of the area of the calcification and the weight ( 1 =130 to 299HU ,
2=200 to 299HU,
3= 300 to 399 HU,
4= above 400 HU) was automatically processed through the program.
Statistical analysis
For statistical analysis,
R version 3.5.1 (R Foundation for Statistical Computing,
Vienna,
Austria) was used.
We performed statistical test with cacs using calcium score CT of Radiologist 1 as reference value.
We used spearman correlation coefficient for correlation of CACS values measured with Chest CT and Calcium score CT and linear regression analysis.
Interobserver correlation and linear regression were also analyzed in the same way A P-value < 0.05 was considered statistically significant.
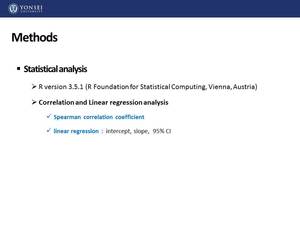
Fig. 10


