Keywords:
Technical aspects, Physics, MR-Diffusion/Perfusion, MR, Elastography, MR physics, Liver, Abdomen, Cirrhosis
Authors:
Y. Matsumoto1, M. Harada2, Y. Kanazawa2, M. Otomo2, D. E. Amgalan1, G. ariunbold1, S. takamastu3, Y. Yamashita3; 1Tokushima-shi/JP, 2Tokushima/JP, 3Otawara-shi/JP
DOI:
10.26044/ecr2019/C-1761
Results
The results of this study are indicated in Figure 2 and 3.
The signal attenuation derived from the three b-values,
ADC0-1500 and D* against the measured shear stiffness,
showed good correlation in comparison to that from the use of five b-values.
In the fast diffusion component of three b-value,
D* resulted in good correlation while there was no correlation on the ADC0-200.
There was no correlation between the measured shear stiffness and the slow diffusion component,
the ADC200-1500,
and D.
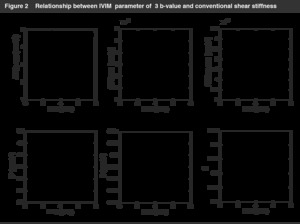
Fig. 7
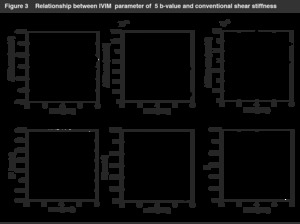
Fig. 8
In each of the results from the linear regression of the estimated parameter maps calculated from the five b-value,
a significant correlation,
(R< ‒0.67),
was observed between ADC0‒200,
D,
and α,
and the measured shear stiffness.
In addition,
the relationship between the D and the measured shear stiffness had the best correlation for five b-value in this study (R=-0.8).
Normal 0 10 pt 0 2 false false false EN-US JA X-NONE
Moreover,
the comparison between conventional shear stiffness and virtual shear stiffness is shown in Figure 4 and 5,
demonstrating a correlation on each of the estimated parameters.
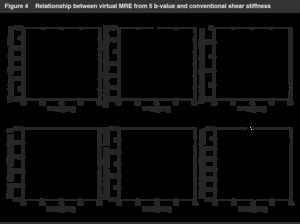
Fig. 9
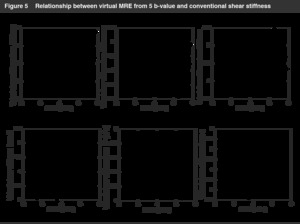
Fig. 10
