MR imaging
In this study,
MR imaging was performed on seven patients with liver diseases,
after obtaining written informed consent (Table 1).
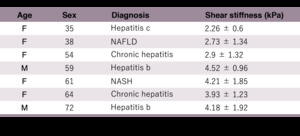
Table 1: Patients information
The patients underwent scanning with a 1.5-T MR system (Signa Explorer,
GE Healthcare,
Chicago,
IL) using conventional MRE and DW imaging sequences.
The imaging parameters and setting values for the conventional MRE and DW images are shown in Table 2.
An external driver device (60 Hz) was used to induce shear waves in the liver tissue,
and axial imaging of the abdomen with breath-holding was performed for conventional MRE.
For calculation of the estimated parameter derived from the IVIM,
DW images (b‒value: 0,
50,
200,
800,
and 1500 s/mm2) with a fat-suppressed spin-echo echo-planar sequence were obtained.
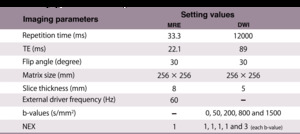
Table 2: Imaging parameters and setting values
Data processing
The procedure of data processing is described below and shown in Figure 8.
A wave image obtained from the conventional MRE was converted to the shear stiffness map using a multi-scale direct inversion algorithm on the MRI equipment (Figure 8a).
Then,
ADC,
D*,
D,
F,
DDC,
and α maps were calculated from the mono-exponential,
bi-exponential,
and stretched models using Bayesian fitting algorithms (see Figure 8b).
In this study,
a region of interest (ROI) analysis was performed for each patient,
and a thresholding method was then applied to the ROI on an estimated parameter map of the IVIM model.
First,
the ROI was placed over the whole liver in these images,
avoiding large blood vessels (Figure 8c).
For the α map,
the threshold values were determined from α (0.01 < α < 1).
The ADC and DDC maps from the mono-exponential and bi-exponential models were obtained and a threshold of less than 0.025 mm2/s was used to remove unwanted ADC and DDC signals.
No threshold was used for D* and D values in this study (Figure 8c).
After removing unwanted signals in the ROI,
linear regression for each of the ROI was applied to confirm how the non-Gaussian diffusion obtained from each of the IVIM models relates to the shear stiffness on the liver tissue (Figure 8d).
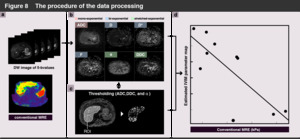
Fig. 8: The procedure of the data processing
Results
The comparison between conventional shear stiffness and the estimated IVIM parameter is shown in Figure 9,
demonstrating each correlation.
In this study,
ADC,
D*,
and α maps showed a strong correlation with the measured shear stiffness derived from conventional MRE images,
compared to the D,
F,
and DDC map (R < ‒0.8).
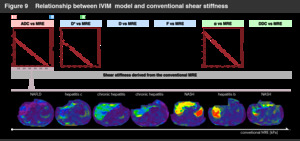
Fig. 9: Relationship between IVIM model and conventional shear stiffness
The purpose of this investigation was to confirm how the non-Gaussian diffusion obtained from each of the IVIM models relates to the shear stiffness on the liver tissue.
Our results suggested that the amount of non-Gaussian diffusion reflected in the estimated IVIM parameter,
while the estimated parameter would also be reflected in the effect of non-Gaussian diffusion,
for not only the slow diffusion component but also the fast diffusion component from the results of the bi-exponential because of the bi-exponential fitting,
D* strongly related to the shear stiffness measured by the conventional MRE,
a significant correlation was not observed in D (R = 0.82 vs 0.13).
This effect was likely to also have been caused by the fitting accuracy of the bi-exponential function associated with several factors.
For example,
the bi-exponential model has three of free models,
f,
D*,
and D.
Thus,
the bi-exponential model would be unsuitable for controlling the fitting accuracy to detect only the extent of non-Gaussian diffusion compared to the mono-exponential and stretched models.
Moreover,
the D map frequently leads to bad accuracy depending on the noise floor [7],
as shown in Figure 10.
In contrast,
the mono-exponential and stretched models are characterized by one and two parameters,
respectively.
The stretched-exponential fitting thus has a more robust behavior in comparison to bi-exponential fitting as it can be represented by a simple exponential equation,
as shown in equation 3 [4].

Fig. 10: Relationship between bi-exponential model and non-Gaussian diffusion
However,
the mono-exponential and stretched models cannot separate the fast and slow diffusion components due to the ADC and α,
and instead observe the whole signal attenuation,
including these diffusion components.
However,
the ADC and α are strongly related to the measured shear stiffness,
similar to the correlation coefficient of D*.
This result means that these maps are empirically related to the non-Gaussian diffusion as shown in Figure 11.
