ECR 2019 / C-2080
Prenatal planning of placenta previa: diagnostic accuracy of a MRI-based model for the placental invasion and clinical outcome prediction
Congress:
ECR 2019
Poster Number:
C-2080
Type:
Scientific Exhibit
Keywords:
Intrauterine diagnosis, Imaging sequences, MR, Pelvis, Obstetrics (Pregnancy / birth / postnatal period), Genital / Reproductive system female, Obstetrics, Foetus
Authors:
A. Delli Pizzi1, E. Mincuzzi1, A. Tavoletta1, D. Mastrodicasa2, R. Narciso1, C. Celentano1, R. Cianci1, A. R. Cotroneo1, R. Basilico1; 1Chieti/IT, 2Charleston/US
DOI:
10.26044/ecr2019/C-2080
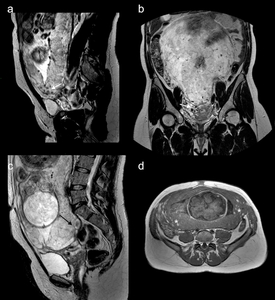
, and coronal (b) T2-weighted images and axial T1-weighted image (d) showing abnormal flow voids (white arrow in a and b), uterine bulging (black arrow in c) and heterogeneous signal intensity due to focal hemorrhage (white asterisks in d). The patient had minor bleeding and underwent conservative treatment (bakri balloon and b-lynch suture). Invasive placenta with accretism was demonstrated at the delivery.")
Fig. 3:
Figure 3. A case of good outcome in a 33-year old pregnant with invasive...
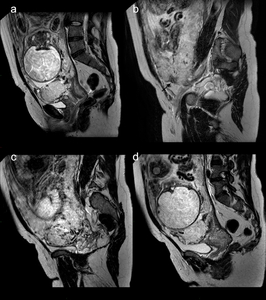
 T2-weighted images showing intraplacental dark bands (white asterisks in a), placental recess (black arrow in b), intraplacental abnormal vascularity (white arrow in c), myometrial thinning with focal indistinctness of its delineation (black asterisk in c) and signs of percretism with bladder invasion (white P” in d). The patient underwent emergency hysterectomy and PAS with percretism was histologically confirmed.")
Fig. 4:
Figure 4. A case of poor outcome in a 36-year old pregnant with invasive...

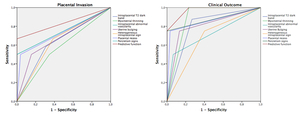
Fig. 5:
Figure 5. ROC curve analysis of MR findings and predictive functions for PAS...