Targeted Therapies
Targeted medical treatments act on molecular signaling pathways crucial to cancer cell survival; and are more specific in targeting tumor cells.
Drug nomenclature reflects the site of action of the drug Fig. 5; which can be broadly divided into monoclonal antibodies acting on the cell surface/circulating growth factors,
and small molecule inhibitors acting within the cell Fig. 1.
The targeted drugs most commonly used in lung cancer are agents targeted at specific genetic aberrations,
anti-angiogenic agents and checkpoint inhibitor immunotherapy.
Agents targeted at specific genetic aberrations
The most common specific genetic aberrations in lung cancer which targeted therapies act upon are epidermal growth factor receptor (EGFR) mutations,
anaplastic lymphoma kinase (ALK) rearrangements and BRAF mutations.
The targeted agents typically used are tyrosine kinase inhibitors (TKI) which inhibit cell growth and division.
Imaging findings and response assessment
Response assessment using radiological size-based parameters (e.g.
(RECIST1.1) underestimates clinical benefit in many lung cancer patients receiving TKIs due to atypical response pattern when compared to cytotoxic chemotherapy.
Examples of such atypical patterns include:
- Long periods of stable disease,
without a RECIST defined response
- RECIST defined progressive disease (PD) followed by long periods of clinical stability
- Initial profound anti-tumor response and subsequent slow re-growth of tumor.
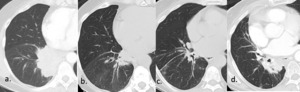
Fig. 6: TKI response patterns:
54 year old female with Stage IV EGFR mutant adenocarcinoma.
(a.) Baseline contrast enhanced CT pre-commencing erlotinib demonstrates large right infrahilar mass.
(b.) CT 2 months post initiation of erlotinib demonstrates significant reduction in size of mass.
(c.) CT 4 months post initiation of erlotinib demonstrates no significant change in size of mass, suggestive of drug efficacy.
(d.) CT at 1 year post initiation of erlotinib demonstrates new increase in size of mass, consistent with development of drug resistance.
This response pattern, initial profound anti-tumor response with subsequent slow re-growth of tumor, is based on hypothesis of oncogene addiction which proposes some tumors rely on one single dominant oncogene for growth and survival, e.g. EGFR, so inhibition of the specific oncogene, leads initially to tumor necrosis but subsequently regrowth due to development of resistance.
These patterns of atypical response in the context of clinical stability highlight the limitations of size-based measurements for capturing clinical effect for targeted therapy.
Complications:
TKI related pneumonitis
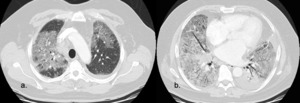
Fig. 7: Tyrosine Kinase Inhibitor induced pneumonitis, diffuse alveolar damage (DAD) pattern.
Contrast enhanced axial CT image shows diffuse groundglass opacification with dependent dense consolidation (black arrow) consistent with DAD pattern pneumonitis.
DAD corresponds to the clinical phenomenon of adult respiratory distress syndrome and is associated with worse clinical outcomes.
- Uncomon,
but clinically important as most common cause for drug related mortality in lung cancer patients receiving TKIs (65% toxicity related deaths) [1].
- Incidence 4% in Japanese population with incidence considerably lower in non-Japanese populations [2].
- Variable CT features including groundglass opacities,
airspace consolidation,
centrilobular nodules,
interlobular septal thickening and honeycombing; typically,
multifocal and bilateral.
TKI related complex renal cysts
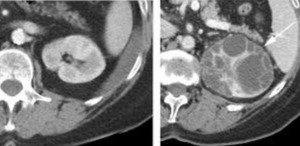
Fig. 8: Crizotinib associated complex renal cysts
Contrast enhanced axial CT image of left kidney in a 68 year old female patient, 10 months after crizotinib treatment shows complex cystic lesion (white arrow) with numerous internal septations, not present on baseline CT (image on left)
- Development of complex renal cysts (in previous simple cysts or de novo) in minority of patients receiving crizotinib.
- Usually asymptomatic,
seen on surveillance imaging.
- Can be confused for renal neoplasm/abscess.
Anti-Angiogenic agents
Vascular endothelial growth factors (VEGFs) are a family of signaling proteins which play a key role in tumor angiogenesis, thus a target for cancer treatments.
In lung cancer,
anti-VEGF agents Bevacizumab and Ramucirumab are FDA approved.
Imaging findings and response assessment
Since the early experience with targeted therapies,
it has been recognized that RECIST1.1 may not adequately capture tumor response as purely sized based assessments fail to account for morphological changes,
such as necrosis and cavitation which occur with anti-angiogenesis agents. As a result,
the Choi criteria were developed for use in patients with gastrointestinal stromal tumors receiving targeted therapy.
- Choi criteria: Take into account both change in size and cahnge in tumor attenuation
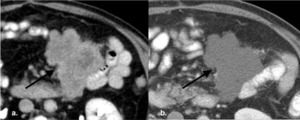
Fig. 9: Choi Criteria proposed initially as response assessment tool in patients with gastrointestinal stromal tumor on imatinib, whose tumor underwent significant necrosis with limited size change which takes both tumor size and tumor attenuation into account when assessing response [3]. A reduction of attenuation > 15% from baseline, suggests treatment response.
(a.) Baseline contrast enhanced axial CT image shows mesenteric GIST (black arrow) which is heterogeneously hyperattenuating pre therapy. (b.) Follow up contrast enhanced axial CT image obtained after 4 months of imanatinib shows no change in size of lesion, however the lesion is reduced in attenuation, suggestive of internal necrosis and treatment response.
- Cavitation: Seen more frequently with anti-angiogenic agent use in lung cancer,
compared to cytotoxic agents
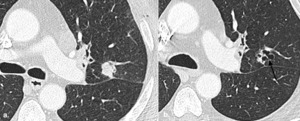
Fig. 10: Cavitary response with use of anti-angiogenic agents is reported more commonly than attenuation changes due to central necrosis.
One study showed 24% patients with NSCLC treated with the anti-angiogenic agent cediranib had a cavitary response, compared to 0 control patients treated with cytotoxic chemotherapy [4].
(a.) Baseline contrast enhanced axial CT image shows solid perifissural squamous cell carcinoma in left upper lobe.
(b.) Follow up contrast enhanced axial CT image obtained after 6 months of therapy, shows no significant overall change in size of lesion but central cavitation.
Modified RECIST criteria which account for cavitary change within a lung mass by subtracting cystic components from solid components have been proposed for use in this context [4].
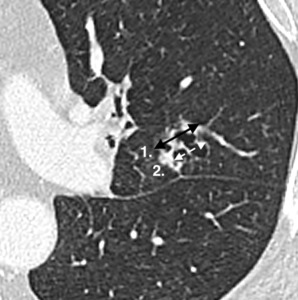
Fig. 11: Modified RECIST response assessment of cavitary lesion.
The whole lesion is measured, measurement 1 (solid black arrow) and then the cavitary component is measured, measurement 2 (dashed white arrow). The residual solid component = measurement 1- measurement 2
Other proposed markers of response include reduced tumor attenuation and increased groundglass change within tumor [4].
However,
none of these criteria are in routine clinical use for lung cancer patients.
Complications
Rare but clinically important complications.
Pulmonary Hemorrhage
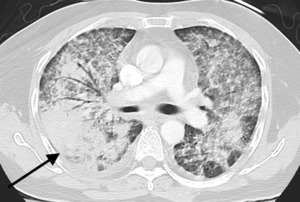
Fig. 12: Bevacizumab associated pulmonary hemorrhage demonstrated by widespread groundglass change and interlobular septal thickening with more focal consolidation seen dependently (black arrow) on CT chest.
In early trials with Bevacizumab (including patients with squamous cell histology), high rates of serious pulmonary hemorrhage were seen. Subsequent trials (excluding patients with squamous cell histology) had lower rates of pulmonary hemorrhage (1-2%) [5].
Contrast enhanced axial CT image shows widespread groundglass change and interlobular septal thickening with more focal consolidation seen dependently (black arrow)
Thromboembolic Events
Increased risk for thromboembolic events,
particularly arterial thromboembolism (incidence 3-5%) [6].
Pneumatosis Intestinalis
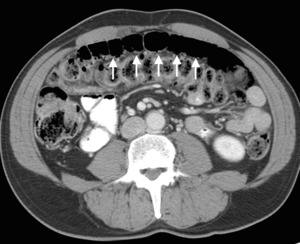
Fig. 13: Bevacizumab associated pneumatosis intestinalis
Contrast enhanced axial CT image shows pneumatosis of transverse colon. The patient was asymptomatic and was managed conservatively with discontinuation of bevacizumab.
Bevacizumab associated pneumatosis intestinalis can occur with frank perforation in 1% patients [7].
Immunotherapy
Immunotherapy with checkpoint blockade is a novel oncologic treatment strategy which provokes anti-tumor response by activating the patient’s immune system,
with numerous trials demonstrating clinical benefit.
Checkpoint inhibitors are monoclonal antibodies which act on cell receptors that regulate the T-cell immune response to cancer (cytotoxic T-lymphocyte antigen-4 (CTLA-4),
programmed cell death protein 1 (PD1) or its ligand programmed cell death ligand 1 (PD-L1)),
ultimately promoting an anti-tumor immune response Fig. 2.
Imaging findings and response assessment
During clinical trials of ipilimumab in patients with melanoma,
it was recognized that a subset of patients who ultimately responded to treatment did not demonstrate the patterns of radiological tumor response classically seen with cytotoxic chemotherapy [8].
Similar atypical patterns of response have been seen in patients with lung cancer; for example:
- Long periods of RECIST defined stable disease with an indolent reduction in tumor burden over many months or years.
- Growth of exiting lesions or appearance of new lesions after treatment initiation,
followed by treatment response (termed pseudo-progression)
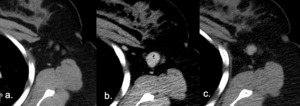
Fig. 14: New lesions post commencing Immunotherapy consistent with Pseudo-progression. This defined as an increase in tumor burden initially after immunotherapy is commenced with a subsequent reduction in tumor burden, often followed by partial or complete response as defined by RECIST criteria [8].
(a.) Baseline axial CT pre commencing immunotherapy showing non-measurable lymph nodes in the left axilla.
(b.) 2 month post initiation of immunotheraph, follow up axial CT image shows newly enlarged left axillary lymph node, which using RECIST 1:1 criteria would be deemed PD.
(c.) However imaging obtained 4 weeks later with patient remaining on immunotherapy now demonstrates a reduction in size of lymph node, suggestive of treatment response.
Pseudo-progression
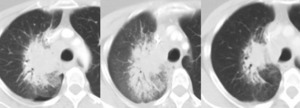
Fig. 15: Another example of pseudo-progression
(a.) Baseline CT prior to initiation of immunotherapy for right perihilar non-small cell lung carcinoma.
(b.) Follow up CT at 2months: The primary neoplasm is increased in size, PD as per RECIST criteria. The immunotherapy was discontinued at this timepoint.
(c.) Follow up CT at 4months (2months off immunotherapy), the primary neoplasm in now smaller in size than on the initial baseline study. These appearances are consistent with treatment response having initially demonstrated pseudo-progression on the interval study.
Uncommon but presents a clinical challenge as no reliable way to differentiate pseudo-progression from true progression on imaging, therefore short-term imaging follow up is required to assess if the increase in tumor burden is transient.
- Occurs in 7-10% of melanoma patients [8]; less common in lung cancer [9]
- Most common within first 12 weeks.
- Can be associated with immune related adverse events.
As these atypical patterns of anti-tumor response are not adequately captured by RECIST1.1,
immunotherapy response assessment criteria (e.g.
irRC; irRECIST; iRECIST) have been created based on the below key tenants Fig. 16 [8].
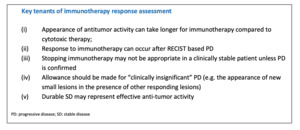
Fig. 16: Table describing key tenants of immunotherapy response for which immunotherapy modified response assessment criteria have been based.
Complications
As immune checkpoint blockade promotes immune system activation,
these agents lead to a number of immune-mediated side effects/immune related adverse events (irAEs). The most common irAEs radiologicaly evident in the chest are pneumonitis and a sarcoid-like reaction
Immunotherapy Related Pneumonitis
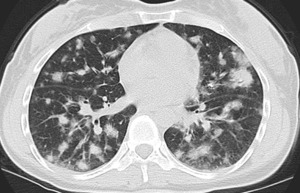
Fig. 17: Immunotherapy related Pneumonitis
Contrast enhanced axial CT image shows diffuse predominantly groundglass nodular opacities with a peripheral predominance which subsequently resolved on follow-up imaging consistent with pneumonitis, organizing pneumonia.
Pneumonitis can be classified according to the ATS/ERS classification of idiopathic interstitial pneumonia with organizing pneumonia-like pattern the most common pattern (65%), which along with AIP subtype are associated with the highest clinical grade of pneumonitis [10].
Incidence in patients receiving anti–PD-1/PD-L1 therapy 5-11% [10].
Typically presents as a low grade pneumonitis which responds to medical management,
but a small percentage of patients develop a more severe pneumonitis which is potentially fatal.
Usual CT findings are groundglass and reticular opacities with diffuse involvement of multiple lung lobes,
although focal disease can occur.
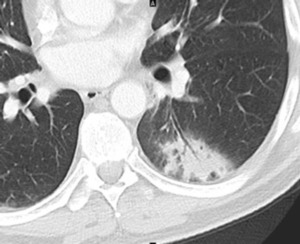
Fig. 19: Immunotherapy related Pneumonitis
Contrast enhanced axial CT image shows focal peripheral left lower lobe consolidation which subsequently resolved on follow-up imaging consistent with pneumonitis, organizing pneumonia. This demonstrates the variability of radiological appearances.
Fig. 18: Immunotherapy related Pneumonitis
Contrast enhanced axial CT image shows diffuse predominantly peripheral groundglass opacities which subsequently resolved on follow-up imaging consistent with pneumonitis, organizing pneumonia. This demonstrates the variability of radiological appearances.
Sarcoid-like reaction
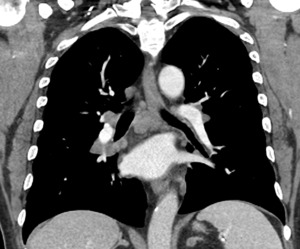
Fig. 20: Sarcoid like reaction
Contrast enhanced coronal CT image shows new multistation mediastinal and hilar lymphadenopathy, subsequently biopsied and confirmed as granulomatous disease.
A T-Cell mediated sarcoid-like reaction is seen in patients receiving checkpoint inhibition therapy, characterized by the development of non-caseating granulomas,
typically presenting as bilateral and symmetrical hilar and mediastinal adenopathy which can be FDG avid on 18F-FDG PET.
Stereotactic Body Radiation Therapy
Stereotactic Body Radiation Therapy (SBRT) delivers high dose,
hypofractionated ablative radiation to a contoured target in a short therapeutic timeframe.
Excellent local control rates has led to significant rise in utilization of SBRT in lung cancer,
especially in non-surgical candidates with early stage NSCLC,
patients with synchronous lung cancers and (less commonly) in patients with local tumor recurrence.
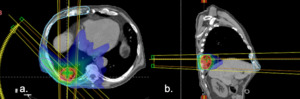
Fig. 21: SBRT treatment plan
(a) axial and (b) saggital images demonstrating complex beam arrangement and steep radiation gradient of SBRT. This ensures a high dose to the tumor and minimizes exposure to normal tissue. However atypical patterns of fibrosis develop.
Imaging findings and response assessment
Post-SBRT CT findings,
classified as early and late phases [12;13],
can differ from the typically well-defined linear opacities post conventional radiation therapy.
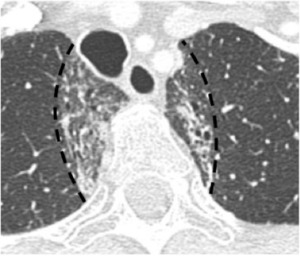
Fig. 22: Classic radiation fibrosis pattern seen following conventional radiation therapy (not SBRT).
Contrast enhanced axial CT image shows classic well demarcated linear opacities (dashed lines) corresponding to radiation field, traction bronchiectasis and air bronchograms. Conventional radiation change responds predictably and is seen in majority of patients within 4 weeks.
Early (<6 months): ‘Radiological pneumonitis’
- Typically asymptomatic.
- Majority of patients develop post radiation opacity by 6 months,
but can take up to 1 year.
Typical imaging findings [12]
- Can remain unchanged from pre-radiation appearance
- Diffuse consolidation
- Patchy consolidation
- Diffuse ground-glass pattern
- Patchy ground-glass pattern
Consolidation patterns are the most common (45% pf patients) [14].
Late (> 6months): 'Radiation fibrosis'
3 main sub-types of late post radiation change:
Modified conventional pattern of fibrosis
- Sharply marginated consolidation with volume loss,
air bronchograms and traction bronchiectasis
- Similar in appearance to conventional radiation fibrosis,
but less extensive and typically localized to the area surrounding treated tumor.
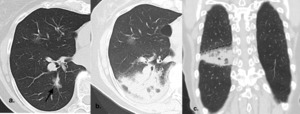
Fig. 23: Modified conventional pattern of fibrosis post SBRT changes
(a.) Baseline contrast enhanced axial CT image shows left lower lobe groundglass nodule, treated with SBRT
(b.) Contrast enhanced axial CT image 3 months post SBRT shows diffuse consolidation pattern of acute post SBRT change
(c.) Corresponding contrast enhanced coronal CT image shows linear border (dashed line) of consolidation relating to radiation field.
Scar-like fibrosis
- Linear fibrosis replacing treated tumor.
Mass-like fibrosis
- Post treatment opacity becomes larger than the treated tumor with mass-like appearance without reassuring imaging features of conventional fibrosis
- Rare 7% [12]
- Can evolve on background of already established conventional pattern.
- Can be misinterpreted as recurrence
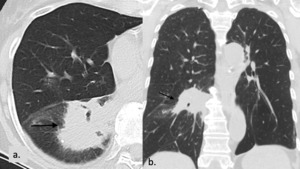
Fig. 24: Mass-like fibrosis post SBRT
(a.) Contrast enhanced axial CT image 2 years post SBRT demonstrating late mass-like SBRT change with loss of reassuring features including linear border
(e.) Corresponding contrast enhanced coronal CT image of late mass-like SBRT change, which remained unchanged on subsequent follow up imaging.
Local recurrence
Local recurrence rate is low following SBRT and rare before 6 months. Sized based CT assessment of tumor response following SBRT results in overestimation of tumor recurrence.
CT features predictive of local recurrence [14;15]
- Loss of linear margin of the opacity
- New convex bulging margin of the opacity
- Loss of air bronchograms
- Sequentially enlarging opacity
- Craniocaudal growth ≥ 5 mm and ≥ 20%.
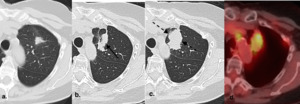
Fig. 25: SBRT recurrence.
There has been varied results in studies which have attempted to validate these features as predictors of recurrence but bulging margin, linear margin disappearance, and craniocaudal growth have been most significantly associated with local recurrence [16;17].
On PET/CT treated lung typically remains FDG avid for the first 3-6 months following SBRT but after 6 months, moderate to intense FDG uptake with a mass-like pattern should raise suspicion for local recurrence, especially if SUV >5 or if the SUV is greater than that of the tumor on pre-treatment PET/CT [18].
(a.) Baseline contrast enhanced axial CT shows left upper lobe adenocarcinoma which was subsequently treated with SBRT (b.) Follow up contrast enhanced axial CT 2 years post SBRT shows opacity at site of treated tumor larger than original tumor but with linear border (black arrow), consistent with SBRT fibrosis (c.) Follow up contrast enhanced axial CT at 2.5 years post SBRT shows increase in overall size with bulging margins (black dashed arrows), suggestive of recurrence (d.) Fused axial PET/CT at 2.5 years shows corresponding FDG avidity, confirming recurrence.
Bulging margin,
linear margin disappearance,
and craniocaudal growth have been most significantly associated with local recurrence [16;17].
Salvage therapy can be performed.
Role of PET/CT
PET/CT potentially has a role in evaluating suspicious CT findings.
Treated lung typically remains FDG avid for the first 3-6 months.
After 6 months,
moderate to intense FDG uptake with a mass-like pattern should raise suspicion for local recurrence [18].
Percutaneous Lung Ablation
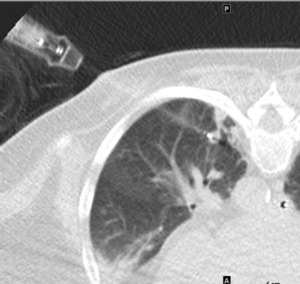
Fig. 4: Coned CT image percutaneous ablation of left lower lobe nodule.
Percutaneous thermal ablation therapies,
including radiofrequency ablation,
microwave ablation,
cryoablation and irreversible electroporation,
offer alternative local therapy in non-surgical candidates with early stage NSCLC.
In the most recent Surveillance,
Epidemiology and End Results Program (SEER) database study regarding overall survival,
thermal ablation was noninferior to SBRT for primary treatment of stage 1 NSCLC [19].
Imaging findings and response assessment
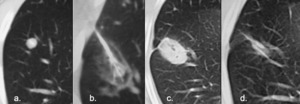
Fig. 26: Classic percutaneous ablation changes.
(a.) Pre treatment CT demonstrating right lower lobe nodule, confirmed as adenocarcinoma in non-surgical candidate.
(b.) CT during percutaneous radiofrequency ablation demonstrating GGO surrounding tumor.
The GGO is felt to demarcate distinct histopathologic zones around tumor: Centrally coagulated tumor, then coagulated pulmonary parenchyma, then mixed coagulation necrosis and hemorrhage in pulmonary parenchyma with surrounding inflammation.
GGO extending > 5mm from the tumor margin should be obtained to ensure an adequate ablation zone and to minimize risk of local recurrence.
(c.) CT 2 months post treatment demonstrates dense opacity at site of previous tumor and larger than original tumor.
Cavitation can occurs in up to 31% of treated lesions in the first 3 months [20].
(d.) CT 8 months post treatment demonstrates opacity smaller than original tumor
- Immediately post-procedure,
treated tumor is surrounded by groundglass opacity (GGO) ± foci of air.
- 1 month post ablation,
GGO is typically replaced by dense opacity.
- 3 months post ablation,
the opacity gradually reduces in size but is generally larger than the treated tumor.
- After 6 months,
opacity is typically smaller than the treated tumor.
Features suspicious for local recurrence [20]
- Any size increase after 3-6 months
- New/increasing peripheral nodularity within the treated lesion
- New/increasing lesional enhancement
- New satellite nodularity around the lesion or along the electrode track.
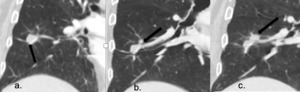
Fig. 27: Recurrence post percutaneous ablation of right lower lobe nodule
(a.) Pre-treatment CT demonstrating right lower lobe nodule, confirmed as adenocarcinoma in non-surgical candidate.
(b.) CT 6 months post ablation shows reduction in size of ablated nodule but new perilesional nodularity.
(c.) CT 12 months post ablation demonstrates unchanged treated right lower lobe nodule but increasing perilesional nodularity confirmed as recurrence.
Regional nodal enlargement can be seen as a transient reactive phenomenon following ablation.
Role of PET/CT
PET/CT potentially has a role evaluating suspicious CT findings.
Immediately post ablation PET is limited as tumor is frequently obscured by uptake from inflammatory change,
however FDG uptake should gradually decrease after 2 weeks.
Suspicious patterns of FDG uptake on follow up PET studies include: focal uptake and rim uptake with focal uptake corresponding to the original tumor nodule [21].
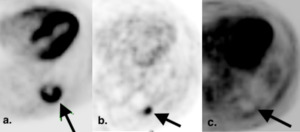
Fig. 28: Suspicious PET findings following percutaneous ablation.
(a.) Baseline axial attenuated corrected PET image pre-radiofrequency ablation for left sided lung cancer shows a FDG avid partially necrotic mass with SUV 10.9.
(b.) Axial attenuated corrected PET, 2 months post RFA shows rim uptake but with focal uptake corresponding to the original tumor nodule, suspicious for recurrence.
Studies have attempted to identify suspicious patterns of FDG uptake on follow up studies. One study described 6 distinct patterns of FDG uptake on the 1st post ablation PET/CT (1-4 months post ablation) with most suspicious uptake patterns: focal uptake (demonstrated here) and rim uptake with focal uptake corresponding to the original tumor nodule [21].
(c.) Subsequent RFA of the mass was performed. PET image 9 months post the salvage procedure demonstrates rim uptake without focal uptake corresponding to the original tumor nodule indicating response to treatment (arrow).

 are a family of signaling proteins which play a key role in tumor angiogenesis, thus a target for cancer treatments.")
, and programmed cell death protein 1 (PD1) or its ligand programmed cell death ligand 1 (PD-L1).
CTLA4 acts to amplify the activation and clonal expansion of T-cells more centrally.
PD1/PDL1 Modulating T-cell activity within the periphery, including the tumor microenvironment specifically.
Thus by targeting CTLA-4 or PD1/PD-L1,the agent ultimately promotes an anti-tumor immune response. References: Dr. Matt Hellman, Department of Oncology, Memorial Sloan Kettering Cancer Center, New York/US")
; or small molecule inhibitors acting within the cell (typically agents end with the suffix -nib).")
 Baseline contrast enhanced CT pre-commencing erlotinib demonstrates large right infrahilar mass.
(b.) CT 2 months post initiation of erlotinib demonstrates significant reduction in size of mass.
(c.) CT 4 months post initiation of erlotinib demonstrates no significant change in size of mass, suggestive of drug efficacy.
(d.) CT at 1 year post initiation of erlotinib demonstrates new increase in size of mass, consistent with development of drug resistance.
This response pattern, initial profound anti-tumor response with subsequent slow re-growth of tumor, is based on hypothesis of oncogene addiction which proposes some tumors rely on one single dominant oncogene for growth and survival, e.g. EGFR, so inhibition of the specific oncogene, leads initially to tumor necrosis but subsequently regrowth due to development of resistance.")
 pattern.
Contrast enhanced axial CT image shows diffuse groundglass opacification with dependent dense consolidation (black arrow) consistent with DAD pattern pneumonitis.
DAD corresponds to the clinical phenomenon of adult respiratory distress syndrome and is associated with worse clinical outcomes.")
 with numerous internal septations, not present on baseline CT (image on left)")
 Baseline contrast enhanced axial CT image shows mesenteric GIST (black arrow) which is heterogeneously hyperattenuating pre therapy. (b.) Follow up contrast enhanced axial CT image obtained after 4 months of imanatinib shows no change in size of lesion, however the lesion is reduced in attenuation, suggestive of internal necrosis and treatment response.")
 and then the cavitary component is measured, measurement 2 (dashed white arrow). The residual solid component = measurement 1- measurement 2")
 Baseline contrast enhanced axial CT image shows solid perifissural squamous cell carcinoma in left upper lobe.
(b.) Follow up contrast enhanced axial CT image obtained after 6 months of therapy, shows no significant overall change in size of lesion but central cavitation.")
 on CT chest.
In early trials with Bevacizumab (including patients with squamous cell histology), high rates of serious pulmonary hemorrhage were seen. Subsequent trials (excluding patients with squamous cell histology) had lower rates of pulmonary hemorrhage (1-2%) [5].
Contrast enhanced axial CT image shows widespread groundglass change and interlobular septal thickening with more focal consolidation seen dependently (black arrow)")

 Baseline axial CT pre commencing immunotherapy showing non-measurable lymph nodes in the left axilla.
(b.) 2 month post initiation of immunotheraph, follow up axial CT image shows newly enlarged left axillary lymph node, which using RECIST 1:1 criteria would be deemed PD.
(c.) However imaging obtained 4 weeks later with patient remaining on immunotherapy now demonstrates a reduction in size of lymph node, suggestive of treatment response.")
 Baseline CT prior to initiation of immunotherapy for right perihilar non-small cell lung carcinoma.
(b.) Follow up CT at 2months: The primary neoplasm is increased in size, PD as per RECIST criteria. The immunotherapy was discontinued at this timepoint.
(c.) Follow up CT at 4months (2months off immunotherapy), the primary neoplasm in now smaller in size than on the initial baseline study. These appearances are consistent with treatment response having initially demonstrated pseudo-progression on the interval study.")

, which along with AIP subtype are associated with the highest clinical grade of pneumonitis [10].")


 axial and (b) saggital images demonstrating complex beam arrangement and steep radiation gradient of SBRT. This ensures a high dose to the tumor and minimizes exposure to normal tissue. However atypical patterns of fibrosis develop.")
.
Contrast enhanced axial CT image shows classic well demarcated linear opacities (dashed lines) corresponding to radiation field, traction bronchiectasis and air bronchograms. Conventional radiation change responds predictably and is seen in majority of patients within 4 weeks.")
 Baseline contrast enhanced axial CT image shows left lower lobe groundglass nodule, treated with SBRT
(b.) Contrast enhanced axial CT image 3 months post SBRT shows diffuse consolidation pattern of acute post SBRT change
(c.) Corresponding contrast enhanced coronal CT image shows linear border (dashed line) of consolidation relating to radiation field.")
 Contrast enhanced axial CT image 2 years post SBRT demonstrating late mass-like SBRT change with loss of reassuring features including linear border
(e.) Corresponding contrast enhanced coronal CT image of late mass-like SBRT change, which remained unchanged on subsequent follow up imaging.")
 Baseline contrast enhanced axial CT shows left upper lobe adenocarcinoma which was subsequently treated with SBRT (b.) Follow up contrast enhanced axial CT 2 years post SBRT shows opacity at site of treated tumor larger than original tumor but with linear border (black arrow), consistent with SBRT fibrosis (c.) Follow up contrast enhanced axial CT at 2.5 years post SBRT shows increase in overall size with bulging margins (black dashed arrows), suggestive of recurrence (d.) Fused axial PET/CT at 2.5 years shows corresponding FDG avidity, confirming recurrence.")
 Pre treatment CT demonstrating right lower lobe nodule, confirmed as adenocarcinoma in non-surgical candidate.
(b.) CT during percutaneous radiofrequency ablation demonstrating GGO surrounding tumor.
The GGO is felt to demarcate distinct histopathologic zones around tumor: Centrally coagulated tumor, then coagulated pulmonary parenchyma, then mixed coagulation necrosis and hemorrhage in pulmonary parenchyma with surrounding inflammation.
GGO extending > 5mm from the tumor margin should be obtained to ensure an adequate ablation zone and to minimize risk of local recurrence.
(c.) CT 2 months post treatment demonstrates dense opacity at site of previous tumor and larger than original tumor.
Cavitation can occurs in up to 31% of treated lesions in the first 3 months [20].
(d.) CT 8 months post treatment demonstrates opacity smaller than original tumor")
 Pre-treatment CT demonstrating right lower lobe nodule, confirmed as adenocarcinoma in non-surgical candidate.
(b.) CT 6 months post ablation shows reduction in size of ablated nodule but new perilesional nodularity.
(c.) CT 12 months post ablation demonstrates unchanged treated right lower lobe nodule but increasing perilesional nodularity confirmed as recurrence.")
 Baseline axial attenuated corrected PET image pre-radiofrequency ablation for left sided lung cancer shows a FDG avid partially necrotic mass with SUV 10.9.
(b.) Axial attenuated corrected PET, 2 months post RFA shows rim uptake but with focal uptake corresponding to the original tumor nodule, suspicious for recurrence.
Studies have attempted to identify suspicious patterns of FDG uptake on follow up studies. One study described 6 distinct patterns of FDG uptake on the 1st post ablation PET/CT (1-4 months post ablation) with most suspicious uptake patterns: focal uptake (demonstrated here) and rim uptake with focal uptake corresponding to the original tumor nodule [21].
(c.) Subsequent RFA of the mass was performed. PET image 9 months post the salvage procedure demonstrates rim uptake without focal uptake corresponding to the original tumor nodule indicating response to treatment (arrow).")