ECR 2019 / C-3567
The impact of training diagnostic radiologists to perform basic interventional procedures
Congress:
ECR 2019
Poster Number:
C-3567
Type:
Scientific Exhibit
Keywords:
Interventional non-vascular, Management, CT, Ultrasound, Biopsy, Drainage, Education and training, Workforce
Authors:
K. Ahmad , E. Hoey, M. Djearaman, A. Ganeshan; Birmingham/UK
DOI:
10.26044/ecr2019/C-3567

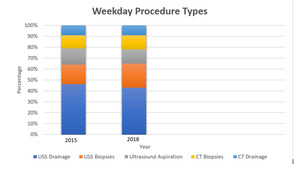
Fig. 1:
Breakdown of Relevant Inpatient Weekday Procedures in 2015 and 2018

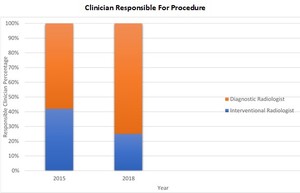
Fig. 2:
Type of Clinician responsible for Interventional Procedure in 2015 and 2018

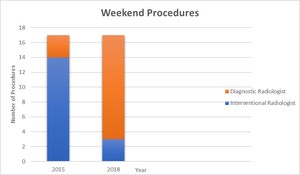
Fig. 3:
Number of Weekend Interventional Procedures in 2015 and 2018