Introduction
Hepatic veins (HV) are large veins that drain blood into the right atrium (RA) through the inferior vena cava (IVC).
There are three major hepatic veins,
named the right hepatic vein,
middle hepatic vein and left hepatic vein.
The hepatic veins appear in ultrasound as thin-walled tubular anechoic structures enclosed by hepatic parenchyma.
They are best approached by a right subcostal oblique view,
allowing a good visualization of the hepatic veins lengthwise and their confluence with the IVC.
Illustration and interpretation of the HV waveform
The hepatic veins have a characteristic waveform with usually four components.
They are named the A,
S,
V and D waves.
Sometimes there may be an extra small wave after the A wave called the C wave.
The normal components of a hepatic waveform are illustrated in figure 1.
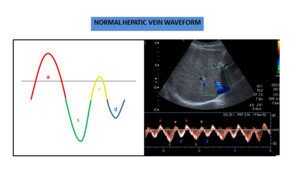
Fig. 1: Normal hepatic vein waveform with four components.
The hepatic venous waveform mirrors pressure changes in the right atriumdue to the cardiac cycle.The bloodflow goes from the liver toward the heart during atrial and ventricular diastole (antegrade direction) and is reversed during atrial systole (retrograde direction).
These cyclical movements of blow flow during each cardiac cycle result in a phasic hepatic venous waveform.
According to convention,
flow above the baseline indicates flow toward the transducer and flow below the baseline indicates flow away from the transducer.
Thus,
in a hepatic approach,
flow toward the liver will appear above the baseline and flow toward the heart below the baseline (figure 2).
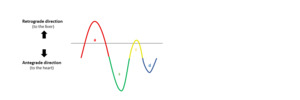
Fig. 2: Representation of flow direction in respect to the circulatory system in the spectral Doppler waveform of the hepatic vein.
In healthy patients,
blood flow in the hepatic vein goes predominantly in the antegrade direction (from the liver to the heart).
Thus,
a normal waveform will be predominantly below the baseline.
Each wave corresponds to a specific phase of the cardiac cycle.
The mechanism behind the generation of each component and the temporal correspondence with each phase of the cardiac cycle are explained in figure 3.
The waves with the peak above the line have a retrograde direction,
while the waves the peak below the baseline have an antegrade direction.
The V wave is transitional,
meaning it may be antegrade,
retrograde or neutral.
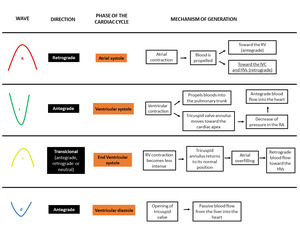
Fig. 3: Scheme representing the components of the hepatic vein waveform, their relation with the cardiac cycle and the underlying mechanism. RA - Right atrium. RV - Right ventricle. HV - Hepatic veins.
The hepatic waveform correlates with concurrently obtained ECG tracings.
This correlation is illustrated in figure 4.
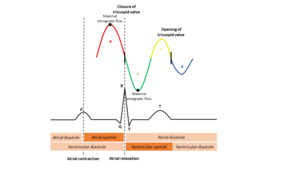
Fig. 4: Correlation between a normal hepatic waveform, the ECG wave and each phase of the cardiac cycle.
Systematic Approach
A systematic approach includes the identification of all the components of the wave,
its relative position and evaluation of the direction of flow. The hepatic wave can also be characterized according to its regularity as regular or irregular and the presence or absence and the degree of phasicity.
Wave components
In order to distinguish each component of the hepatic vein waveform,
some features may help in guiding.
In physiologic states:
- The A wave is taller than the V wave,
with its peak above the baseline; the peak of the V wave may be above the line,
on the line or below the line (transicional wave);
- The A wave is larger than the V wave;
- The S wave is larger than the D wave in most patients;
- The S wave is deeper or is at the same level than the D wave – this is called a S ≥ D pattern.
The A wave remains wider than the V wave in pathologic states,
except in severe tricuspid regurgitation,
in which there is a reversal of the S wave.
Phasicity
The presence of flow means that there is (some form of) phasicity.
The triphasic patterncorresponds to a normal phasicity in the hepatic vein waveform.
The absence of flow implies an absence of phasicity.
The absence of phasicity is the typical finding of Budd-Chiari Syndrome with complete obstruction.
Budd-Chiari Syndrome may also manifest as a wave with decreased phasicity if the obstruction is incomplete or with increased flow velocities and turbulence at the level of stenosis.
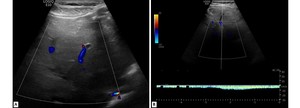
Fig. 5: Spectral (A) and color Doppler (B) of a patient with chronic Budd-Chiari Syndrome as a vascular complication of hepatic amebic abscess. There are some venous segments with an absence of color flow (A). The spectral tracing of a segment with the presence of color flow shows a waveform with decreased phasicity (B).
In the presence of phasicity,
we can further classify it as having an increased phasicity (pulsatile wave) or decreased phasicity.
There is an increased phasicity when both the antegrade and retrograde velocities are increased,
resulting in taller retrograde waves and deeper antegrade waves.
The diseases that commonly result in pulsatile waves are right-sided heart failure and tricuspid regurgitation.
There is a decreased phasicity when the both the antegrade and retrograde velocities are decreased,
resulting in shorter retrograde waves and less deep antegrade waves.
The classic example of decreased phasicity is the presence of hepatic cirrhosis.
A normal liver easily adapts to the changing pressure waves,
producing a normal waveform. In the presence of hepatic fibrosis,
the veins lose their ability to accommodate retrograde flow,
resulting in a decreased phasic oscillation (figure 6).
Hepatic masses,
ascites or other causes of raised intra-abdominal pressuremay also result in dampening of the waveform.
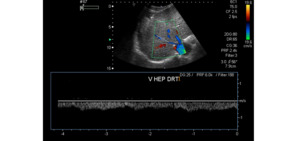
Fig. 6: Spectral Doppler of a patient with hepatitis C-related liver cirrhosis shows a hepatic vein waveform with a monophasic pattern.
Influence by other factors
The hepatic vein waveform is affected by numerous factors,
so an abnormal waveform with a biphasic or monophasic pattern is a common finding in healthy adults if the tracings were not obtained during optimal patient and technical conditions.
During deep expirations and Valsalva maneuver,
there is not sufficient blood returning to the heart through the hepatic veins,
resulting in a decreased phasicity of the wave.
(Figure 7 – B and C).
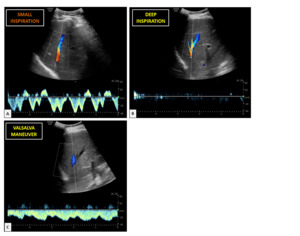
Fig. 7: Hepatic vein waveforms of a twenty-six-years-old healthy woman: A – After a small inspiration; B – After a deep inspiration; C- Performing a Valsalva maneuver. After a small inspiration, there is a normal waveform pattern, whereas after a deep inspiration and during the Valsalva maneuver there is a wave with decreased phasicity.
Another cause of waveform blunting is pregnancy. These changes revert to a normal appearance in most patients by 8 weeks after childbirth.
Phase quantification
Phase quantification is controversial among authors.
Some classified the hepatic vein waveform into three to four grades through a simple visual analysis of the tracing,
while others describe more complex indices with continuously variable values.
In this work, we illustrate a simple classification suggested by Bolondi et al,
which classifies the phasicity of the hepatic vein waveform into three degrees:
- HVO: Triphasic waveform with a short phase of reversed flow (triphasic pattern);
- HV1: Decreased amplitude of the phasic oscillations without the short phase of reversed flow (biphasic pattern);
- HV2: Flat waveform without phasic oscillation (monophasic pattern).
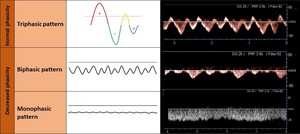
Fig. 8: Degrees of phasicity of the hepatic venous waveform.
Regularity
A wave may be classified as regular or irregular.
Technical or patient factors are common causes of an irregular wave (eg.
when patients do not cooperate with breathing instructions).
However,
we must also have in mind that the presence of an arrythmia will cause an irregular waveform.
Effect of respiration on hepatic veins flow
The respiration cycle in one of the most important factors affecting the amplitude of the waves. Tracings should be obtained during suspended respiration after a small inspiratory breath hold,
allowing enough blood to return to the heart to produce a normal waveform.
The respiratory cycle has a direct effect on intrathoracic pressure.
This,
in turn,
affects the pressure of the cardiac chambers.
The influence of inspiration and expiration on cardiac blood flow and on the Doppler waveform is represented in figure 9.
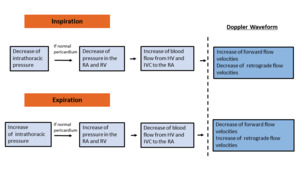
Fig. 9: Scheme demonstrating the effect of inspiration and expiration in the hepatic vein waveform.
An illustration of the hepatic vein waveform after inspiration and expiration is shown in figure 10.
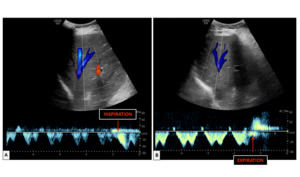
Fig. 10: Spectral Doppler waveform of the hepatic vein after a small inspiration (A) and after a small expiration (B).
The changes explained in figure 9 will only happen in the presence of a normal pericardium.
Cardiac tamponade and pericardial constriction will prevent normal transmission of changes in intrathoracic pressure to the right atrium and right ventricle.
Pathologic hepatic vein waveform
Tricuspid regurgitation
Tricuspid regurgitation (TR) in a common finding in general population and,
in the presence of a structurally normal tricuspid valve,
a mild TR can be considered a normal variant.
However,
moderate to severe TR is often associated with leaflet abnormalities and/ or annular dilatation.
TR is usually secondary to a hemodynamic load on the right ventricle (secondary type) and its most common causes are left heart failure and pulmonary hypertension.
The main feature influencing the spectral waveform is a decreased systolic antegrade flow during ventricular systole.
This will result in a S wave at the same level or less deep than the D wave - called a decreased S wave or S ≤ D pattern.
When TR is severe enough, there may be a reversal of the S wave,
resulting in a retrograde S wave; the S wave will thus be above the baseline and will merge with the A and V waves to form a retrograde A-S-V complex.
Figure 11 illustrates the typical findings of the Doppler waveform and the mechanism behind their generation.
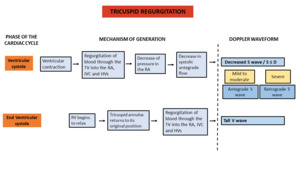
Fig. 11: Scheme demonstrating the features of the Doppler waveform in tricuspid regurgitation and their underlying mechanism.
TR can be classified as mild,
moderate and severe.
The more severe the tricuspid regurgitation,
the lower the peak systolic velocity in the hepatic veins and the taller the V wave. These stages are represented in figure 12.
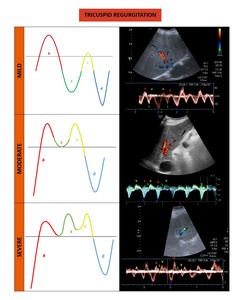
Fig. 12: Degrees of tricuspid regurgitation.
Right-sided heart failure
The primary abnormality in right heart failure,
as long as the tricuspid valve remains competent, is an excessive volume of blood in the right cardiac chambers.
This will cause a larger volume of blood toward the IVC and HVs during atrial systole and ventricular systole,
manifesting in spectral Doppler tracing as taller A and V.
Figure 13 illustrates the typical findings of the Doppler waveform and the mechanism behind their generation.
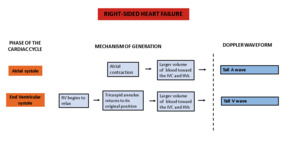
Fig. 13: Scheme demonstrating the features of the Doppler waveform in right heart failure and and their underlying mechanism.
Figure 14 illustrates a diagram and a spectral Doppler of a typical waveform in right-sided heart failure.
Although one of the typical findings in right heart failure ia a tall A wave,
if severe heart failure in present,
a marked decrease in atrial contraction may paradoxically result in an absent A wave.
Pulmonary hypertension
The RV has a crescent-shaped geometry that makes it poorly tolerant to acute elevations in afterload. The response to an increase in pulmonary arterial pressure will thus depend mostly on its time of evolution.
In the presence of chronic pulmonary hypertension,
the slow evolution will allow an adaptive response with myocardial hypertrophy and a rise in ventricular pressure.
However,
if the change is sudden,
as may happen with acute pulmonary embolism,
the RV is unable to adapt and will result in ventricular dilatation.
This may cause an enlargement of the annulus of the tricuspid valve and valvular incompetence.
Progressive worsening of right ventricular function,
as well as severe tricuspid regurgitation,
may both result in right-sided heart failure.
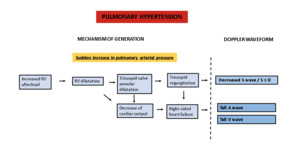
Fig. 15: Scheme demonstrating the features of the Doppler waveform in pulmonary hypertension and their underlying mechanism.
Constrictive pericarditis
Constrictive pericarditis is a rare condition characterized by loss of pericardial compliance.
It clinically manifests with signs of right heart failure.
The typical finding of the hepatic venous waveform in constrictive pericarditis is an extra retrograde wave before the A wave caused by premature attainment of the maximum capacity of the right atrium.
Since the A wave is also retrograde,
the two will together form a W-shaped wave form – W wave pattern (figure 16).
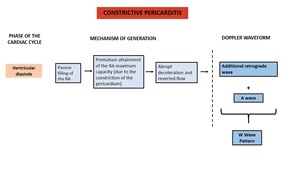
Fig. 16: Scheme demonstrating the features of the Doppler waveform in constrictive pericarditis and their underlying mechanism.
Figure 17 illustrates a diagram and a spectral Doppler of a characteristic waveform in constrictive pericarditis.
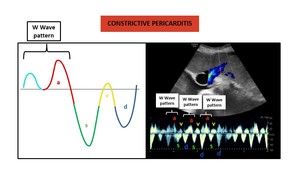
Fig. 17: Diagram (left) and spectral Doppler (right) of a typical waveform in constrictive pericarditis. It should be noted that in this tracing the S wave is slightly less deep that the D wave. This patient had also a echocardiographically proven mild tricuspid regurgitation.
Absence of the A Wave
The A wave,
corresponding to the atrial systole,
may be absent in atrial fibrillation and atrial flutter due to low right atrial volume.
As stated above,
it also may be a finding in severe right heart failure.
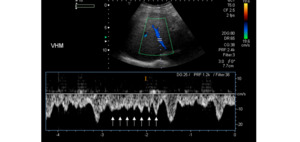
Fig. 18: Hepatic waveform of a patient with a known atrial flutter shows with multiple ondulations due to repeated atrial contraction and relaxation.
Take-home points
Figure 19 summarizes the main causes of an abnormal phasicity,
regularity and pathologic wave patterns.
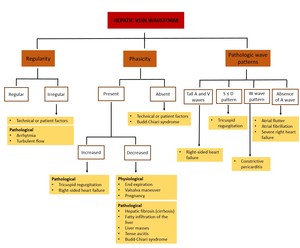
Fig. 19: Summary of the main causes of abnormal phasicity, regularity and pathologic wave patterns.


 and color Doppler (B) of a patient with chronic Budd-Chiari Syndrome as a vascular complication of hepatic amebic abscess. There are some venous segments with an absence of color flow (A). The spectral tracing of a segment with the presence of color flow shows a waveform with decreased phasicity (B).")


 and after a small expiration (B).")


 and spectral Doppler (right) of a typical waveform in right-sided heart failure. It should be noted that in this tracing the S wave is slightly less deep than the D wave. This patient had also an echocardiographically proven mild tricuspid regurgitation.")


 and spectral Doppler (right) of a typical waveform in constrictive pericarditis. It should be noted that in this tracing the S wave is slightly less deep that the D wave. This patient had also a echocardiographically proven mild tricuspid regurgitation.")

