ECR 2020 / C-05643

Small airway diseases on HRCT: Imaging beyond the main airpipe
Congress:
ECR 2020
Poster Number:
C-05643
Type:
Educational Exhibit
Keywords:
Observational, Not applicable, Infection, Connective tissue disorders, Atelectasis, Structured reporting, Observer performance, Comparative studies, Image manipulation / Reconstruction, CT-High Resolution, CT, Thorax, Respiratory system, Lung, Chest
Authors:
U. S. Umer, S. Alam, S. Gul, S. Ghulam ghaus, A. Nawaz Khan, H. Abid, S. Iqbal, K. Nawab; Peshawar/PK
DOI:
10.26044/ecr2020/C-05643

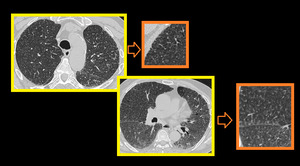
Fig. 1:
3D Volume rendered CT Bronchogram images and reformatted cross sectional volume...
.")
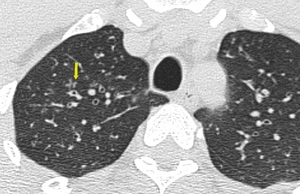
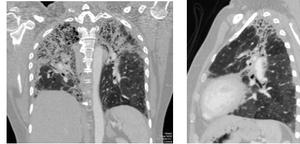
Fig. 2:
HRCT images showing Thick walled bronchioles seen in right lower lobe, some...
.")
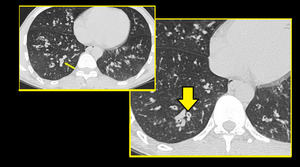
Fig. 3:
Patient with infective bronchiolitis showing multiple centrilobular nodules and...

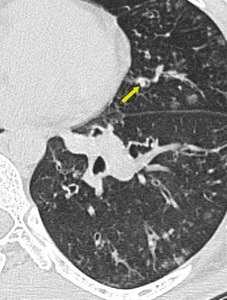
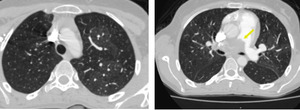
Fig. 4:
Mucus impacted bronchioles seen in right upper lobe

Fig. 5:
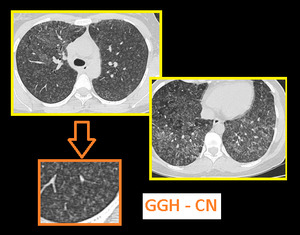
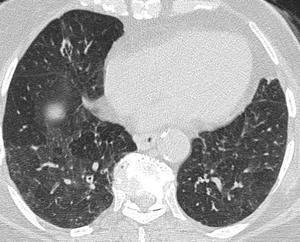
Soft ground glass haze centrilobular nodules and patchy mosaic attanuation are...

Fig. 6:
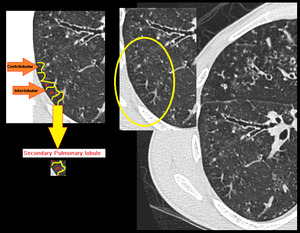
Centrilobular nodules seen in center of secondary pulmonary lobule.

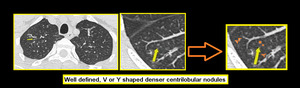
Fig. 7:
Centrilobular nodules seen in center of secondary pulmonary lobule.
.
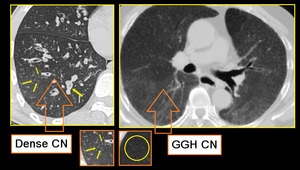
GGH CN - Axial section of lungs in a patient with allergic alveolitis. Subtle mosaic low attenuation also noted in background lung suggesting constrictive bronchiolitis.
Important to remember that centrilobular nodules of hypersensitivity pneumonitis (right image) differ from those of infectious cellular bronchiolitis (left image) in that in HP, these are usually diffuse, poorly defined, and of ground-glass attenuation rather than soft-tissue attenuation.")
Fig. 9:
Small airway disease with multiple centrilobular bronchioles.
DENSE CN -...
. There are bilateral soft ground glass haze like centrilobular nodules. Subpleural interstitial septal thickening is seen bilaterally.")
Fig. 10:
Axial high resolution CT image of a chronic smoker with respiratory...

Fig. 11:
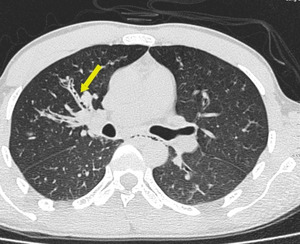
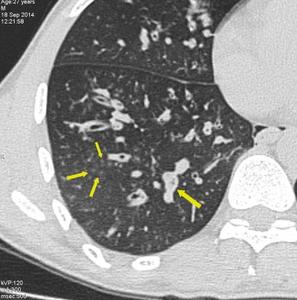
Tree in bud like branching centrilobular nodules are seen in right upper lobe...

Fig. 12:
Axial image at level of aortic arch shows better visualization of branching...
.
Few dilated bronchioles in left lower lobe also show wall thickening and are filled with secretions.")
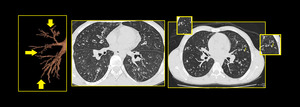
Fig. 13:
Bronchiolectasis: Dilated small airways seen in both lungs (arrow).
Few...

Fig. 14:
Bilateral patchy mosaic attenuation in a case of hypersensitivity pneumonitis....

Fig. 15:
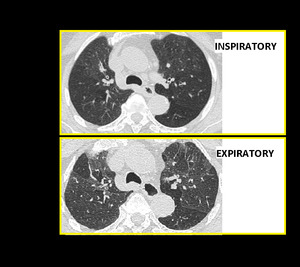
Air Trapping. Inspiratory and end expiratory axial HRCT images showing patchy...

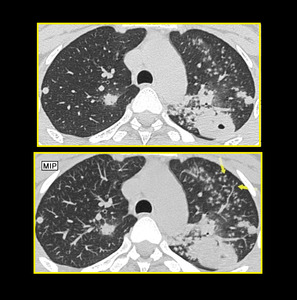
Fig. 16:
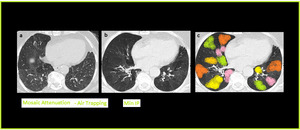
MinIP in Air Trapping. Axial CT image with Min-IP shows increase in the...

Fig. 17:
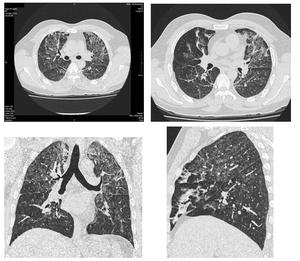
Multiple axial and reformatted images showing chronic changes of small airway...

Fig. 18:
Thin slice MDCT reformatted images showing interstitial pulmonary fibrosis with...

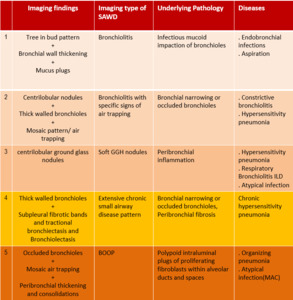
Table 1:
Characteristic imaging patterns of small airway diseases on HRCT scan.
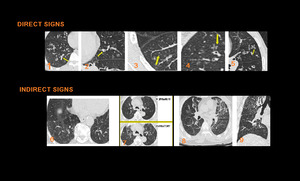
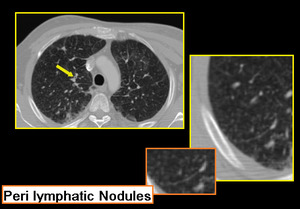
, plugs (2), Centrilobular Nodules (3), which are either ill-defined ground glass opacity or well-defined centrilobular branching V or Y nodules, Tree-in-bud opacities (4),Bronchiolectasis (5). Indirect signs of small airway disease include Mosaic pattern of attenuation on inspiratory CT scan (6) and air trapping on expiratory CT scan (7), Vascular attenuation (8), Increased lung volume & Subsegmental atelectasis (8,9)")
Fig. 19:
Direct signs of small airway disease include Bronchiolar wall thickening (1),...

Fig. 20:
Sarcoidosis with infiltrative ground glass haze. Bilateral patchy areas of...

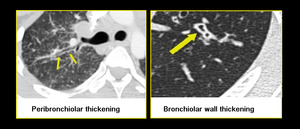
Fig. 21:
Peri-bronchial thickening of sarcoidosis versus bronchiolar wall thickening in...

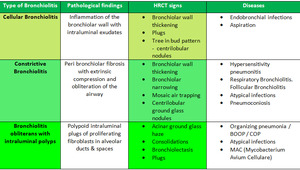
Table 2:
showing combined classification of pathological types and radiological...

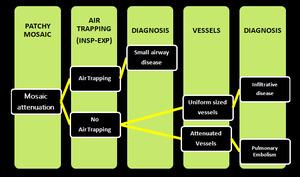
Fig. 23:
showing different possible diseases with mosaic attenuation pattern on HRCT...

Table 3:
showing radiological and pathological classification combined to propose a...