TABLE OF CONTENTS
- Parenchymal Pseudolesions
o Focal Fatty Liver and Focal Spared Areas
o Inflammatory Pseudotumors (IPT)
o Peliosis Hepatis
o Confluent Hepatic Fibrosis
o Segmental Hypertrophy
o Parenchymal Compression
- Vascular Pseudolesions
o Transient Hepatic Attenuation/Intensity Differences (THAD/THID)
o Vascular Malformations
Parenchymal Pseudolesions
Focal Fatty Liver and Focal Spared Areas
Fat accumulation is one of the most common conditions of the liver. Fatty liver is characterized by the accumulation of triglyceride droplets in hepatocytes not in the extracellular matrix.[4]
Focal Fatty Change (FFC) is related to veins of third inflow(Fig. 3). These veins carry blood richer in various hormones that dilute regional portal flow and induce ischemia. Both factors contribute to fat accumulation. Conversely, focal sparing regions are perfused by veins of third inflow poorer in dietary elements absorbed in the small intestine. This may cause areas of focal sparing in a diffuse fatty liver. There are common areas for both FFC and focal sparing and uncommon areas like perivascular and perilesional.
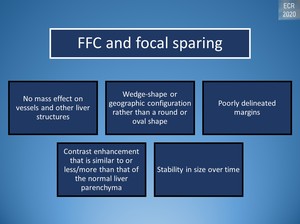
Fig. 20: Radiologic appearance of FFC/focal sparing
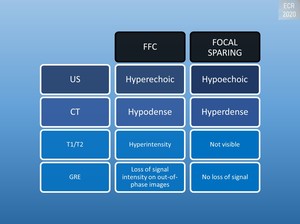
Fig. 19: Radiologic appearance of FFC/focal sparing
FFC and focal sparing appear geographic but may be nodular or mass-like and can cause pseudotumor appearance.[1]
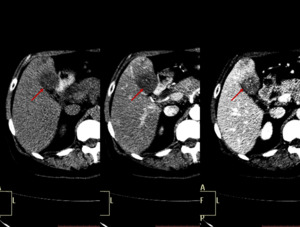
Fig. 32: Typical appearance of FFC. Unenhanced and enhanced CT images present a mass-like region of hypoattenuation in the posterior aspect of liver segment IV (red arrow).
The MIP image shows an aberrant right gastric vein draining in this region (yellow arrow).
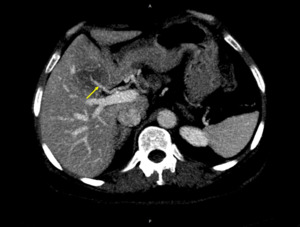
Fig. 33: Typical appearance of FFC. Unenhanced and enhanced CT images present a mass-like region of hypoattenuation in the posterior aspect of liver segment IV (red arrow).
The MIP image shows an aberrant right gastric vein draining in this region (yellow arrow).
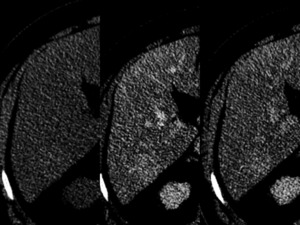
Fig. 23: Atypical appearance for focal spared area on a fatty liver. CT scan pre and post intravenous contrast administration shows, in liver segment VI, a barely perceptible nodular region of hyperattenuation on unenhanced images (left). In arterial (center) and portal (right) phases, the lesion does not show significant enhancement. The lesion has poorly delineated margins and shows no mass effect. It cannot be differentiated from other focal lesions based on this scan alone.
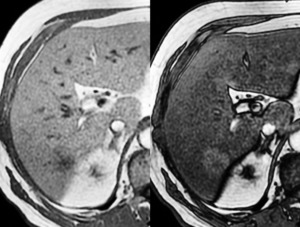
Fig. 24: Same patient as in Fig.23. At the MRI scan on GRE images, it shows no drop in signal intensity in out-of-phase images (right) compared to in-phase images (left) compared to the rest of the liver. This is more indicative of an area of focal sparing.
An unusual pattern is multifocal fatty liver distributed widely with no obvious relationship to vascular flow.[3]
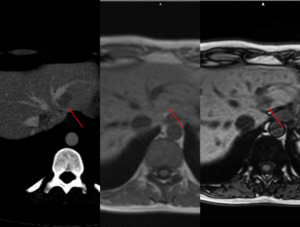
Fig. 34: Multifocal fatty liver with no obvious relationship to vascular flow. CT scan shows multiple regions of hypoattenuation on unenhanced-CT and portal phase (arrow). The same patient undergoes an MRI scan for follow-up. There is no restricted diffusion.GRE imaging demonstrates intracellular fat with a drop of signal on out-of-phase images.
Thorough knowledge is useful in discriminating if an abnormal imaging finding is induced by a true lesion.[4]
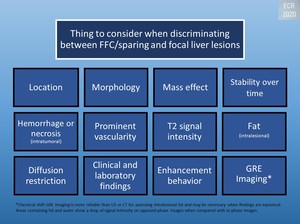
Fig. 5: DDx between FFC/focal sparing and focal liver lesions
Inflammatory Pseudotumors (IPT)
Inflammatory pseudotumor is a rare benign lesion of unknown origin but occlusive phlebitis or an undetected incautious agent are suspected as the primary cause. They occur most commonly in the lung and orbit but have been reported at nearly all body sites.[7]
It’s in the
differential diagnosis of liver masses because can mimic malignant tumors. The radiologist should be familiar with this entity and help avoid unnecessary surgery when possible.[7]
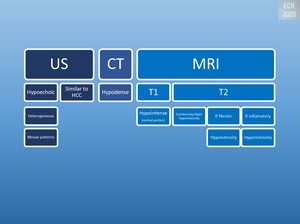
Fig. 6: Radiologic appearance of inflammatory pseudotumors
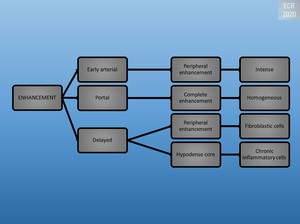
Fig. 7: Enhancement of inflammatory pseudotumors
Most cases are solitary, well-circumscribed, encapsulated solid tumors, mainly arising from the right hepatic lobe. [1]
The lesions are more common in men than women, especially young adults.[1]
-
|
Name by dominant histologic components:
|
|
Xanthogranuloma
|
|
Fibrous xanthoma
|
|
Plasmacellular granuloma
|
|
Histiocytoma
|
|
Pseudolymphoma
|
|
Plasmocytoma
|
Clinical manifestations:
- Acute inflammatory process
- Recurrent pyogenic cholangitis
- Large lesions cause a sensation of fullness or discomfort[1]
Peliosis Hepatis
Peliosis hepatis is a rare entity characterized by blood-filled cystic cavities (< 1 mm to several cms) distributed randomly throughout the liver. First described in patients with advanced cancer and tuberculosis and users of anabolic steroids.[8]
Imaging findings vary with the size of lesions, presence or absence of thrombus within the cavities, and presence of hemorrhage. The microscopic form has no specific characteristics. [1]
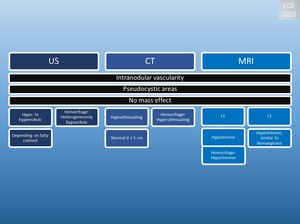
Fig. 8: Radiologic appearance of peliosis hepatis
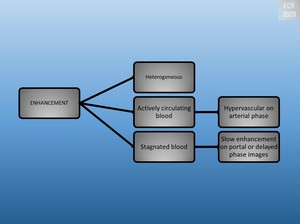
Fig. 9: Enhancement of peliosis hepatis
The macroscopic form:
- Single or multiple lesions
- Appear infiltrating or resemble abscesses.[1]
Confluent Hepatic Fibrosis
It is generally caused by chronic injury to the liver patients with long-standing cirrhosis and vascular injury to the liver.
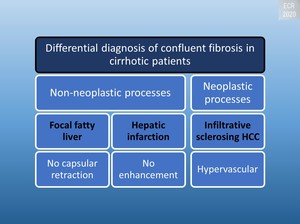
Fig. 10: Differential diagnosis of confluent fibrosis in cirrhotic patients
The specific location is often the medial segment of the left and/or right lobe.[1]
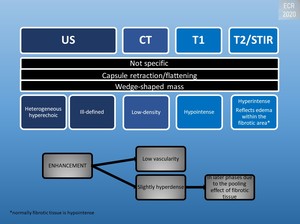
Fig. 12: Radiologic appearance of confluent fibrosis
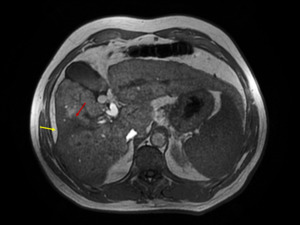
Fig. 21: Confluent hepatic fibrosis. Dysmorphic fibrous liver with cirrhotic changes seen as irregular borders and a relatively prominent left lobe and caudate. At the junction between segments VIII and V, a wedge-shaped area of confluent fibrosis (red arrow) radiates from the portal hilum and retracts the liver capsule (yellow arrow).
Segmental Hypertrophy
In conditions such as cirrhosis, Budd-Chiari syndrome or primary sclerosing cholangitis the liver may be dysmorphic in appearance.
Chronic Budd-Chiari syndrome:
- Due to its independent venous drainage, the caudate lobe may increase in volume
Sclerosing cholangitis
- Atrophy of the affected segments
- Compensatory hypertrophy in other segments in which bile flow is maintained [1]
On CT and T1-weighted:
- Hyperdense/hyperintense
- Pseudotumoral aspect.[1]
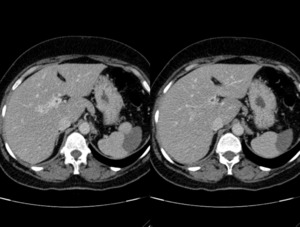
Fig. 31: Caudate lobe hypertrophy in a patient with portal cavernoma.
Parenchymal Compression
-
|
Reduced portal perfusion but no modification in the arterial supply
|
|
Most commonly locations - the subcapsular region of liver segments
|
V and VI
|
Rib compression
|
|
VII and VIII
|
Diaphragmatic compression
|
If suspected a follow-up CT may be done to change the association between the rib/diaphragm and adjacent liver at a different inspiration level or the patient in a decubitus position. [1]
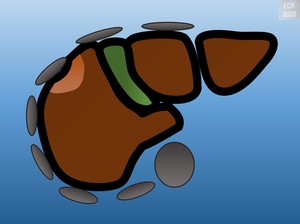
Fig. 11: Parenchymal Compression
Vascular Pseudolesions
Transient Hepatic Attenuation/Intensity Differences (THAD/THID)
Regions with altered proportions of arterial and venous flow results in an enhancement disparity between them and the rest of the liver.[5]
Increased arterial flow in a particular region will result in a THAD/THID (visible only on enhanced CT/MRI).
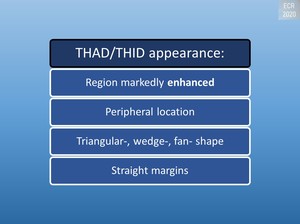
Fig. 13: THAD/THID appearance
Causes of increased hepatic arterial flow:
- Primary
o Hypervascular lesions
o Inflammation
o Aberrant arterial supply
- Secondary
o Decrease in portal flow
§ Peripheral
· Increase in sinusoidal pressure
· Compression
§ Central
· Thrombosis[6]
Portal flow decreased in a region (<75%) leads to arterio-portal shunting:
- Hepatic arterial buffer response
o Arterial inflow increases (>25%) to sustain total blood flow (100%)
- Arterial phase
o Region markedly
enhanced
- Portal phase
o Contrast inflow is
similar to the rest of the liver[6]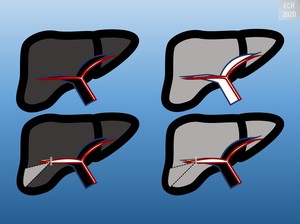
Fig. 2: Pharmacodynamics of normal liver contrast enhancement(up) and of THAD (down)
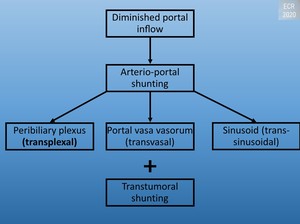
Fig. 18: Arterio-portal shunting
Third inflow will produce THAD/THID if there is a delay in contrast inflow between this route and the main portal vein. The parabiliary system drains into the portal vein but can drain directly into the liver and enlarges to supply blood to the center of the liver when is the case of a portal obstruction, forming a portal cavernoma. The epigastric-paraumbilical venous system is a route in case of superior or inferior vena cava obstruction. Both systems are also well-known collateral pathways in portal hypertension.[5]
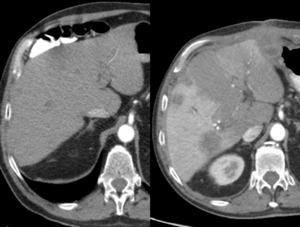
Fig. 22: Arterial phase CT scan pre (left) and post (right) right portal vein ligation. Increased enhancement of right liver lobe, when compared to the left liver lobe, through secondary increased artery perfusion. Replaced right hepatic artery(not seen here) arising from the superior mesenteric artery with increased diameter after the procedure when compared to images before the procedure.
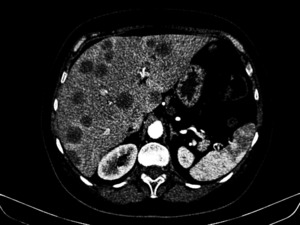
Fig. 25: Multiple colorectal hepatic metastases.
Multiple nodular hypoattenuating regions distributed widely. It looks similar to multifocal hepatic steatosis but has mass effect on the adjacent parenchyma and the patient has a primary tumor.
Arterial phase CT scan of a patient with know colorectal cancer shows perimetastatic arterioportal shunts of a secondary cause.
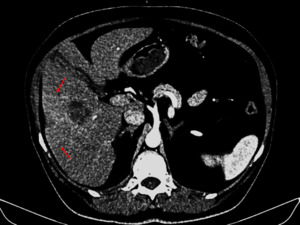
Fig. 26: Arterial phase helical CT scan in a patient with THAD caused by a liver abscess. Arterialization is caused by a primary increase in arterial flow due to hyperemia. It could also be caused by the reduction of portal inflow because of interstitial edema. The abscess produces compression on a portal branch which results in a fan-shaped arterialization defect (arrows).
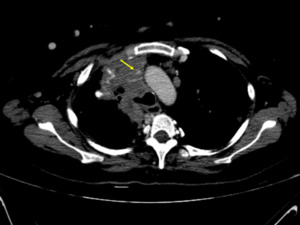
Fig. 27: Superior vena cava syndrome with hotspot sign, multiple collateral vessels, peripheric THAD in a young patient with multiple fibrotic nodules distributed widely throughout the body including the liver (red arrows). The nodules wore biopsied multiple times and show stability over time.
Venous phase CT section shows a barely visible superior vena cava (yellow arrow).
Arterial phase CT shows a peripheric arterialized liver, hotspot sign in a region connected to the periumbilical-epigastric venous system.
Portal phase CT shows enlarged portal vein and splenic veins with multiple collateral vessels belonging to the peribiliary venous system.
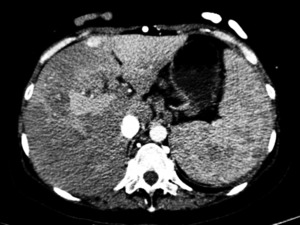
Fig. 28: Superior vena cava syndrome with hotspot sign, multiple collateral vessels, peripheric THAD in a young patient with multiple fibrotic nodules distributed widely throughout the body including the liver (red arrows). The nodules wore biopsied multiple times and show stability over time.
Venous phase CT section shows a barely visible superior vena cava (yellow arrow).
Arterial phase CT shows a peripheric arterialized liver, hotspot sign in a region connected to the periumbilical-epigastric venous system.
Portal phase CT shows enlarged portal vein and splenic veins with multiple collateral vessels belonging to the peribiliary venous system.
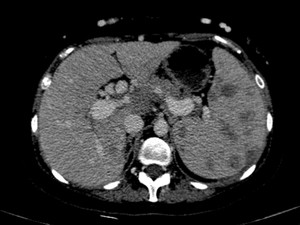
Fig. 29: Superior vena cava syndrome with hotspot sign, multiple collateral vessels, peripheric THAD in a young patient with multiple fibrotic nodules distributed widely throughout the body including the liver (red arrows). The nodules wore biopsied multiple times and show stability over time.
Venous phase CT section shows a barely visible superior vena cava (yellow arrow).
Arterial phase CT shows a peripheric arterialized liver, hotspot sign in a region connected to the periumbilical-epigastric venous system.
Portal phase CT shows enlarged portal vein and splenic veins with multiple collateral vessels belonging to the peribiliary venous system.
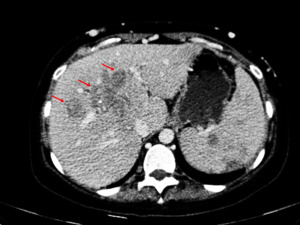
Fig. 30: Superior vena cava syndrome with hotspot sign, multiple collateral vessels, peripheric THAD in a young patient with multiple fibrotic nodules distributed widely throughout the body including the liver (red arrows). The nodules wore biopsied multiple times and show stability over time.
Venous phase CT section shows a barely visible superior vena cava (yellow arrow).
Arterial phase CT shows a peripheric arterialized liver, hotspot sign in a region connected to the periumbilical-epigastric venous system.
Portal phase CT shows enlarged portal vein and splenic veins with multiple collateral vessels belonging to the peribiliary venous system.
Vascular Malformations
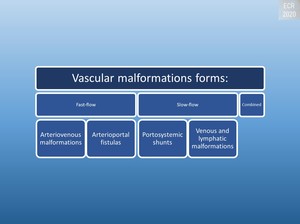
Fig. 14: Forms of vascular malformations
Arteriovenous Malformations (AVMs)
AVMs are congenital abnormalities of blood vessels that shunt blood through direct arteriovenous connections without neoplastic tissue in between.[1]
Clinical Findings:
- Neonates
o Congenital Heart Failure
o Anemia
o Hepatomegaly
o Portal hypertension
- Late childhood
o Hereditary hemorrhagic telangiectasia[1]
Signal hypointensity on T2-weighted images and the absence of progressive enhancement is useful for discrimination from hemangiomas.[1]
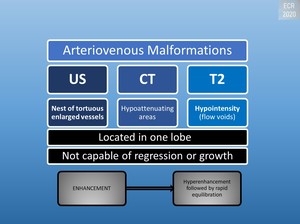
Fig. 15: Radiologic appearance of AVMs
Arterioportal Fistulas
May be intra- or extrahepatic and acquired or congenital. Congenital arterioportal fistulas are a rare cause of portal hypertension.[1]
Acquired arterioportal fistulas in:
- Cirrhosis
- Hepatic neoplasms
- Trauma
- Iatrogenic
Clinical Findings:
- Portal hypertension
- Hepatofugal portal flow
- Splenomegaly
- Variceal formation
- Ascites
- Intestinal dysfunction[1]
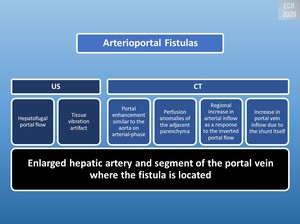
Fig. 16: Radiologic appearance of arterio-portal fistulas
Portosystemic Shunts
Abnormal cystic or tubular anechoic structures communicating between portal venous branches and hepatic veins. Both extrahepatic and intrahepatic portosystemic shunts have been described.[1]


.
The MIP image shows an aberrant right gastric vein draining in this region (yellow arrow).")
.
The MIP image shows an aberrant right gastric vein draining in this region (yellow arrow).")
. In arterial (center) and portal (right) phases, the lesion does not show significant enhancement. The lesion has poorly delineated margins and shows no mass effect. It cannot be differentiated from other focal lesions based on this scan alone.")
 compared to in-phase images (left) compared to the rest of the liver. This is more indicative of an area of focal sparing.")


 radiates from the portal hilum and retracts the liver capsule (yellow arrow).")


. The nodules wore biopsied multiple times and show stability over time.
Venous phase CT section shows a barely visible superior vena cava (yellow arrow).
Arterial phase CT shows a peripheric arterialized liver, hotspot sign in a region connected to the periumbilical-epigastric venous system.
Portal phase CT shows enlarged portal vein and splenic veins with multiple collateral vessels belonging to the peribiliary venous system.")

