Steps in MRS acquisition Fig. 4
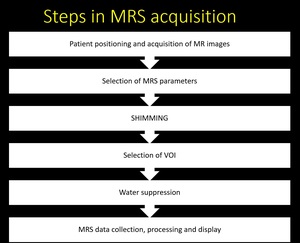
Fig. 4: Sequential steps in MRS acquisition
TYPES OF MRS
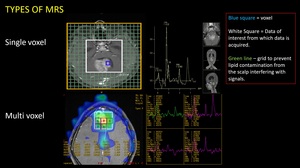
Fig. 5: 2 types of MR Spectroscopy
(1) Single Voxel
(2) Multi Voxel
Single voxel
• A small volume is selected (1x1x1 cm)
• Voxel positioning is critical- Voxel must be positioned away from sources of susceptibility artifacts and lipids
• Excellent shim and spectral resolution
• The main limitation of this technique is restricted anatomic coverage ie, the assessment of only one single area during normal acquisition
Multi voxel (MVS)
• Larger volume is selected which yields spectra from multiple voxels simultaneously
• Spectral resolution is moderate
• preferred technique for the evaluation of intra-cranial neoplasm
MR spectroscopic imaging (MRSI) or chemical-shift imaging (CSI)
• Can be 2D (single-slice) or 3D (multi-slice)
• More anatomic coverage than single voxel or multivoxel techniques
• Data is presented as a colour coded image for each of the metabolite of interest
• Higher grade of shimming is required (difficult in posterior fossa)
Localization Techniques in MRS Fig. 6
Four methods are commonly used for localisation of volume of interest.
- STEAM
- PRESS
- ISIS
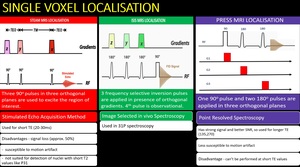
Fig. 6: Three types of single voxel localisation
(1)STEAM
(2)ISIS
(3)PRESS
4. CSI – chemical shift imaging
CSI is also termed as MRSI (Magnetic resonance spectroscopic imaging) as it combines features of both imaging and spectroscopy.
Used for multivoxel spectroscopy to cover a large area.
Spatial localisation is done by phase encoding in one, two or three directions to get one, two, three-dimensional spectroscopy respectively.
Major metabolites
MRS detects neuronal metabolite NAA, the glial metabolite myoinositol, choline-containing compounds such as glycerophosphocholine and phosphocholine, neurotransmitters Glu and g-aminobutyric acid, antioxidants glutathione and ascorbate, and other important metabolites such as Cr, phosphocreatine, Gln, and lactate (Lac).
If the four main peaks of a spectrum (Ins, Cho, Cr, and NAA) are connected by a manually drawn line, the angle with respect to the X-axis is 45° in healthy subjects, an angle referred to as Hunter angle Fig. 7
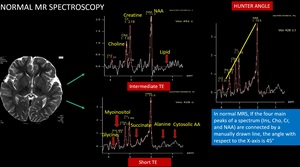
Fig. 7: Normal MRS spectrum and Hunter angle
NAA is a neuronal metabolite. It has 3 peaks NAA1 – 2.02, NAA2 – 2.6 and NAA3- 2.5ppm. Any insult to brain causing neuronal loss or degeneration causes reduction in NAA.
NAA concentration increases in Canavan’s disease.
Creatine is an energy metabolite which serves as high energy phosphate and as a buffer in ATP/ADP reservoir. It has two peaks, Cr1 – 3.0ppm and Cr2-3.94ppm.
Increased: In trauma, Hypometabolic states.
Reduced: Hypoxia, stroke, necrosis, malignant tumor (where it is used up already), in hypermetabolic states- hyperthyroidism, congenital creatine deficiency syndromes.
Choline is a constituent of phospholipids in cell membrane, so it’s an indicator of cell membrane integrity.
• Increased in condition of: myelin breakdown, hypercellular state– tumor (increased cell turnover).
• Reduced in hepatic encephalopathy, stroke (decreased number of cells).
Myoinositol Acts as an osmolyte (cell volume regulator). It is a marker of gliosis that resonates at 3.5 ppm.
• Increases in- Alzheimer’s disease, frontal lobe dementias (as neuron number deceases and glial cell marker increases), diabetes, hyperosmolar states, lesions with glial component – hypothalamic hamartoma.
• Decreases in - hepatic encephalopathy (edema), stroke, tumor (as in these cases glial cell also decreases in number). hyponatremia, osmotic pontine myelinolysis
Lactate is a doublet that shows peak at 1.3ppm. At intermediate TE of 135ms, its peak gets inverted. It’s a marker of hypoxia.
Lactate is elevated in
- hypoxia
- tumor
- Mitochondrial encephalopathy
- Canavan’s disease
- Alexanders disease
Lipid is a maker of acute brain injury resulting in myelin destruction. It usually has two peaks. Lip1 at 0.9ppm and Lip2 at 1.3ppm. This can be differentiated from lactate peak by its board peak, shoulder to left and suppressed at TE 270.
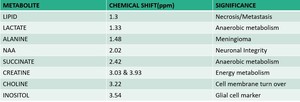
Fig. 8: Major metabolites with corresponding peak and significance
Cases 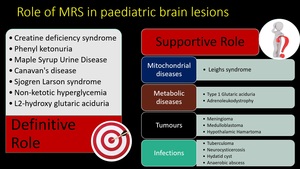
Fig. 9: Role of MR spectroscopy in pediatric brain lesions.
MRS can be diagnostic in some conditions and it supports conventional MRI in some other conditions.
(1) Creatine deficiency syndrome
Occurs as autosomal recessive disease due to deficiencies of arginine-glycine amidinotransferase (AGAT)and guanidinoacetate methyltransferase (GAMT) or as X-linked disorder due to mutation of SLC6A8 that codes for cellular transporter of creatine. Conventional MRI is usually normal. Magnetic resonance spectroscopy shows a markedly reduced or completely absent creatine peak; this is most easily seen on long TE spectra. In addition, short TE sequences show a broad guanidinoacetate peak at 3.78 ppm.
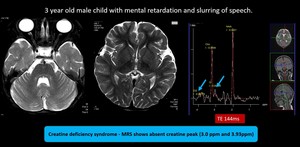
Fig. 10: Creatine deficiency syndrome - MRI brain showed no significant abnormality.
MRS shows absent creatine peak (3.0 ppm and 3.93ppm), MRS feature is diagnostic for Creatine deficiency syndrome
(2) Phenylketonuria
Common inborn error of amino acid metabolism, caused by mutations in the phenylalanine hydroxylase (PAH) gene. The MR in PKU can appear normal. T2/FLAIR imaging shows hyperintensity in the periventricular WM, particularly frontal and peritrigonal regions. The subcortical arcuate fibers are spared. MRS shows a Phe peak resonating at 7.37 ppm.
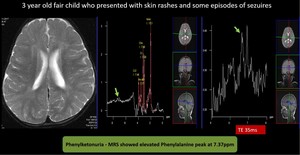
Fig. 11: Phenylketonuria - MRI brain didn’t revealed any significant abnormality.
Due to strong clinical suspicion chemical shift scale was extended till 9 ppm.
MRS showed elevated Phenylalanine peak at 7.37ppm.
Provisional diagnosis of Phenylketonuria was made and later confirmed by chemical analysis.
(3) Maple Syrup Urine Disease
Autosomal recessive disorder of branched-chain amino acid (leucine, isoleucine, valine) metabolism. Within days after birth, poor feeding, lethargy, vomiting, seizures can occur. MR shows diffusion restricting T2/FLAIR hyperintensity involving the cerebellar WM, dorsal brainstem, cerebral peduncles, basal ganglia, internal medullary lamina, and pyramidal and tegmental tracts. MRS shows a peak at 0.9 ppm caused by accumulation of branched-chain α-keto amino acids which resonates at short (35 ms), intermediate (144 ms), and long (288ms).
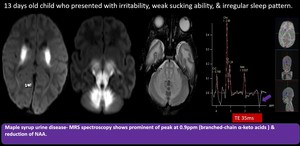
Fig. 12: Maple Syrup Urine Disease
Diffusion restricting bilateral symmetrical T2 & FLAIR hyperintensities with T1 hypointensity seen in perirolandic fronto parietal whitematter, the corticospinal tracts within the centrum semiovale, corona radiata, posterior limb of internal capsule, thalami, midbrain, pons and medulla, as well as the cerebellar white matter.
MRS spectroscopy shows prominent peak at 0.9 ppm ( BCAAs and branched-chain α-keto acids ) reduction of NAA.
Diagnosis of Maple Syrup Urine Disease was made. (MSUD)
(4) Nonketotic Hyperglycinemia
Autosomal-recessive disorder in glycine metabolism. Affected child presents with lethargy, hypotonia, apnoea, seizures, and often myoclonic jerks. The initial MR may appear completely normal; adjunctive MRS shows glycine peak at 3.55 ppm on short and long TE. Later restricted diffusion and T2/FLAIR hyperintensity within the corticospinal tracts and flocculus of the cerebellum can develop.
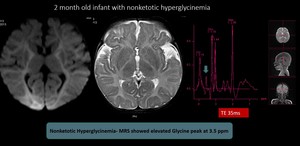
Fig. 13: Nonketotic Hyperglycinemia- MRI brain didn't reveal significant abnormalities. MRS showed elevated Glycine peak at 3.5 ppm and diagnosis of nonketotic hyperglycinemia was made
(5) Sjogren-Larsson syndrome
Autosomal recessive neurocutaneous syndrome and leukodystrophy with clinical triad of ichthyosis, intellectual disability, and spastic diplegia or tetraplegia. Confluent T2/FLAIR hyperintensities of the white matter, typically involving the periventricular white matter and centrum semiovale, often with a posterior or occipital predominance. In MRS abnormal resonance at 1.3 ppm, only in cerebral white matter, indicative of accumulation of lipids.
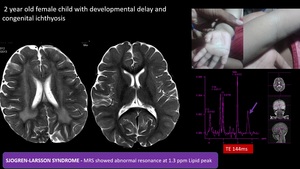
Fig. 14: SJOGREN-LARSSON SYNDROME - Confluent T2 hyperintensities in periventricular white matter with posterior predominance.
MRS showed Abnormal resonance at 1.3 ppm (Lipid peak) , only in cerebral white matter- due to accumulation of lipids such as fatty aldehydes and fatty alcohols,with clinical correlation of congenital icthyosis diagnosis of SJOGREN-LARSSON SYNDROME was made.
(6) Canavan disease
Fatal autosomal-recessive neurodegenerative disorder caused by a defect in a metabolite—N-acetyl-L-aspartate (NAA). MR eventually shows virtually complete absence of myelination with confluent T2/FLAIR hyperintensity throughout the WM and globi pallidi. Markedly elevated NAA is seen.
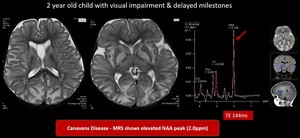
Fig. 15: Canavan disease- Symmetrical T2 hyperintensities in bilateral cerebral hemispheres involving subcortical white matter, globus pallidus, dentate nucleus, relatively sparing corpus callosum, caudate nucleus & putamen
MRS shows elevated NAA peak (2ppm) which is in favour of Canavan disease
(7) L-2-hydroxyglutaric aciduria
Autosomal recessive disease with gene mutation of L2HGDH. Clinical features are developmental delay and learning difficulties. MRI changes seen are bilateral and symmetrical with centripetal pattern of involvement, with the white matter abnormalities affecting the subcortical U-fibers. MRS shows 2HG peak at 2.5ppm and mI peak at 3.5ppm
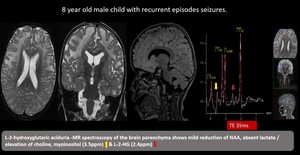
Fig. 16: L-2-hydroxyglutaric aciduria -Bilateral supratentorial subcortical white matter T2 / flair hyperintense lesion with relatively preserved deep periventricular white matter and corpus callosum. Bilateral dentate nucleus,caudate and putamen show involvement.
MR spectroscopy of the brain parenchyma shows mild reduction of NAA, absent lactate / elevation of choline, myoinositol (3.5ppm) & L-2-HG (2.4ppm)
(8) Leighs syndrome
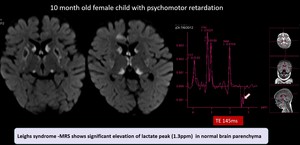
Fig. 17: Leighs syndrome -Symmetrical diffusion restricting lesions in bilateral caudate , lentiform , thalamus.MRS shows significant elevation of lactate peak (1.3ppm) in normal brain parenchyma
(9) Type 1 glutaric aciduria
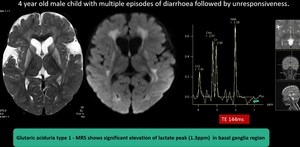
Fig. 18: Type 1 Glutaric aciduria- Batwing shaped widened sylvian fissures with hypoplasia of the underlying temporal lobes.Basal ganglia hyperintensity involving caudate and lentiform nucleus, fronto parietal deep white matter and central tegmentum with diffusion restriction.
MRS shows significant elevation of lactate peak (1.3ppm) in basal ganglia region
(10) Neuronal ceroid lipofuscinosis
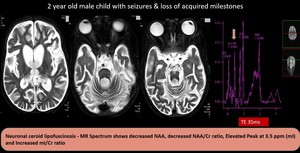
Fig. 19: Neuronal ceroid lipofuscinosis - Diffuse cerebral & cerebellar atrophy with T2 hyperintensities in the lobar white matter.MR Spectrum shows decreased NAA, decreased NAA/Cr ratio, Elevated Peak at 3.5 ppm (mI) and Increased mI/Cr ratio
(11)Adrenoleucodystrophy
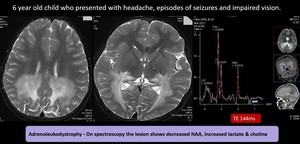
Fig. 20: Adrenoleukodystrophy- Abnormal symmetrical hyperintensity in the peritrigonal parietooccipital whitematter, splenium of corpus callosum, cerebral peduncle, brain stem corticospinal tract, middle cerebellar peduncle with areas of microhemorrhages & peripheral leading edge enhancement in the parietooccipital whitematter.
On spectroscopy the lesion shows decreased NAA, increased lactate & choline – Features favours adrenoleukodystrophy
(12)Medulloblastoma
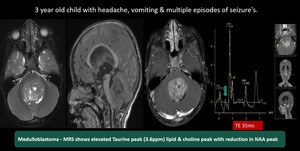
Fig. 21: Medulloblastoma - Well defined large heterogeneously enhancing mass lesion measuring about 3.5 x 4.5 x 5.3 cm arising from the 4th ventricle causing moderate obstructive hydrocephalus and trans ependymal seepage of csf.
MR spectroscopy shows reduction of NAA , elevation of choline, Elevated lipid lactate peak and Taurine peak
Features are suggestive of Medulloblastoma (group 3)
(13) Meningioma
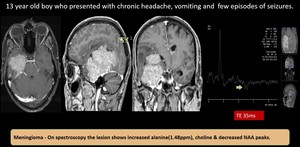
Fig. 22: Meningioma - well defined mass lesion with broad base towards right petrous apex and tentorium which extends into temporal horn of right lateral ventricle with prominent arterial feeder from the meningeal vessel and from the right posterior cerebral artery. The lesion shows intense contrast enhancement and causes mass effect.
MR spectroscopy shows elevated choline with reduced NAA. There is elevated lactate / alanine peak - features in favour of meningioma
(14) Hypothalamic Hamartoma
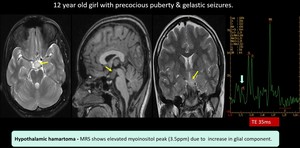
Fig. 23: Hypothalamic hamartoma- Well defined non enhancing collar button lesion noted between the infundibular stalk and mammillary body.
MRS shows elevated myoinositol peak due to increase in glial component. Suggestive of hypothalamic hamartoma.
(15) Tuberculoma
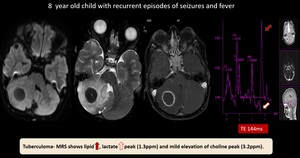
Fig. 24: Tuberculoma - Well defined non diffusion restricting T2 hypointense, rim enhancing lesion with perilesional oedema noted in right cerebellar hemisphere.
MRS shows lipid, lactate peak (1.3ppm) and mild elevation of choline peak (3.2ppm).
Features suggestive of tuberculoma
(16) Neurocystercosis
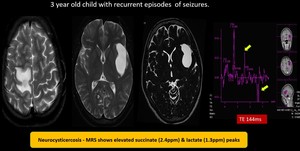
Fig. 25: Neurocysticercosis - Multiple tiny cystic lesions of varying sizes with mural nodules noted in bilateral frontal region. Well defined T2 hyperintense lesion in left sylvian fissure without enhancement showing elevated succinate (2.4) & lactate (1.3) peak on spectroscopy suggestive of Neurocysticercosis
(17) Hydatid cyst
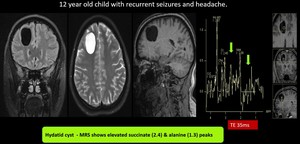
Fig. 26: Hydatid cyst- Well defined T1, T2 Flair hypo & T2 hyperintense lesion in right frontal lobe
MRS shows elevated Alanine(1.4), succinate(2.4) and pyruvate(2.48) peaks, suggestive of Hydatid cyst
(18) Anaerobic abscess
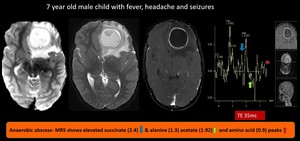
Fig. 27: Anaerobic abscess- well defined diffusion restricting T2/Flair heterointense mass lesion showing rim enhancement after contrast administration noted in left frontal region with significant surrounding edema and mass effect in the form of mild mid line shift to right.
MRS shows elevated succinate (2.4) & alanine (1.3) acetate (1.92) and amino acid (0.9) peaks, suggestive of anaerobic abscess.

