In the population of 105 patients with isolated lateral malleolus fracture,
40 patients were excluded.
Of the 65 eligible patients,
40 (61.5%) were female and 25 (38.5%) were male.
The mean age was 50.7 (Max 85 and Min 14) with a standard deviation of 17.5.
Regarding laterality,
31 (47.7%) were on the right and 34 (52.3%) were on the left.
Forty-seven (72.3%) were victims of falls,
15 (23.1%) of sports accidents and 3 (4.6%) of traffic accidents.
In group I (MERS),
instability was confirmed in 60 (92.3%),
by measuring a medial clear space:
- 4-4.9 mm in 24 (36.9%)
- ≥ 5 mm in 36 (55.4%)
The mean clear space,
measured with deltoid ligament injury (exposed patients) was 6.3 (max 17.7 and min 4) with a standard deviation of 3.2 and a 95% confidence interval of 5.5-7.2.
In cases without deltoid ligament injury (unexposed patients) it was 3.3 (max 3.7 and min 2.6) with a standard deviation of 0.6 and a 95% confidence interval of 1.8-4.9.
In group II (GS),
instability was confirmed in 62 (95.3%),
by measuring a medial clear space:
- 4-4.9 mm in 35 (53.8%)
- ≥ 5 mm in 27 (41.5%)
The mean medial clear space,
measured in mm,
in group II with deltoid ligament injury (exposed patients) was 5.89 (max 23 and min 4) with a standard deviation of 3.4 and 95% confidence interval of 5.0 to 6.7.
In cases with no deltoid ligament lesion (patients not exposed),
it was 3.1 (max 3.8 and min 2.6) with a standard deviation of 0.6 and a 95% confidence interval of 1.6-4.7.
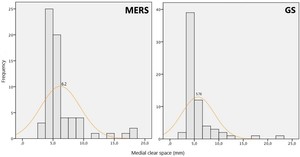
Fig. 6: Distribution of the valid and reliable test results, centered on the mean value.
References: Isabel Rosa
In group I (MERS) and II (GS) it was,
respectively,
obtained a sensitivity of 97% and 100%,
while the specificity was 100% and 60%,
a positive predictive value (PPV) of 100% and 97% and a negative predictive value (NPV) of 60% and 100%. [Table 1,2]
|
Group I
|
Deltoid ligament integrity
as evidenced by the GS x-ray
|
|
MERS
x-ray
test
|
|
With lesion
≥4 mm
|
Without lesion
<4mm
|
TOTAL
|
|
Positive test
≥4 mm
|
TP = 60
|
FP = 0
|
60
|
|
Negative test
<4mm
|
FN = 2
|
TN = 3
|
5
|
|
TOTAL
|
62
|
3
|
65
|
Table 1 - Comparison of the results of the MERS stress test with the integrity of the deltoid ligament as evidenced by the GS x-ray.
TP=true positive; FP=false positive; TN=true negative; FN=false negative
|
Group II
|
Deltoid ligament integrity
as evidenced by the MERS x-ray
|
|
GS
x-ray
test
|
|
With lesion
≥4 mm
|
Without lesion
<4mm
|
TOTAL
|
|
Positive test
≥4 mm
|
TP = 60
|
FP = 2
|
62
|
|
Negative test
<4mm
|
FN = 0
|
TN = 3
|
3
|
|
TOTAL
|
60
|
5
|
65
|
Table 2 - Comparison of the results of the GS stress test with the integrity of the deltoid ligament as evidenced by the MERS x-ray.
TP=true positive; FP=false positive; TN=true negative; FN=false negative
Regarding the predictive value for deltoid ligament lesion between a medial clear space of ≥4 mm (4-4.9 mm) versus ≥5 mm,
it was verified on the group that a space greater than five has a sensitivity,
specificity,
PPV and NPV of 100%,
respectively,
while a space of 4 to 4.9 has a specificity and PPV of 100% and a sensitivity of 91% and NPV of 60%.
[Table 3]
| |
Deltoid ligament integrity
as evidenced by the GS x-ray
|
|
MERS
x-ray
test
|
|
Positive test
4-4.9 mm
|
Positive test
≥5 mm
|
Negative test
<4mm
|
TOTAL
|
|
Positive test
4-4.9 mm
|
20
|
4
|
0
|
24
|
|
Positive test
≥5 mm
|
13
|
23
|
0
|
36
|
|
Negative test
<4mm
|
2
|
0
|
3
|
5
|
|
TOTAL
|
35
|
27
|
3
|
65
|
Table 3 - Comparison of the results of the MERS stress test,
with the integrity of the deltoid ligament as evidenced by the GS x-ray, with the distinction of a medial clear space of ≥4 mm (4-4.9 mm) and ≥5 mm.
In Tables 4 and 5,
the readings performed by the 1st observer were schematized in cross-tabulation with the second reading performed in a different time (intra-observer) and with a second observer (inter-observer).
In the MERS x-ray test,
there was 95% agreement in the intra-observer variation,
while in the inter-observer it was 88%,
with a very strong association between the variables in study (Qui Square) with p-value = 0.000.
The percentage agreement expected only by chance,
was 45.2% in the intraobserver and 45.5% in the interobserver evaluations,
resulting in a Kappa statistic value of 0.91 and 0.78,
respectively.
In the GS x-ray test,
there was a 97% agreement in the intra-observer variation,
while in the inter-observer it was 91%,
also with a very strong association between the variables in the study, with a p-value = 0.000.
The percentage agreement expected only by chance,
was 46.3% in the intraobserver and 45.2% in the interobserver evaluations,
resulting in a Kappa statistic value of 0.94 and 0.84,
respectively.
|
MERS
x-ray test
|
Medial clear space measurement
|
|
1st Observer
|
Intra-observer
|
Inter-observer
|
TOTAL
|
|
<4
mm
|
4-4.9
mm
|
≥5
mm
|
<4
mm
|
4-4.9
mm
|
≥5
mm
|
|
<4 mm
|
4
|
1
|
0
|
5
|
0
|
0
|
5
|
|
4-4.9 mm
|
1
|
22
|
1
|
0
|
19
|
5
|
24
|
|
≥5 mm
|
0
|
0
|
36
|
0
|
3
|
33
|
36
|
|
TOTAL
|
5
|
23
|
37
|
5
|
22
|
38
|
65
|
Table 4 - Variation of the observer clear space measurement in the MERS x-ray test.
The underline marks the agreement.
|
GS
x-ray test
|
Medial clear space measurement
|
|
1st Observer
|
Intra-observer
|
Inter-observer
|
TOTAL
|
|
<4
mm
|
4-4.9
mm
|
≥5
mm
|
<4
mm
|
4-4.9
mm
|
≥5
mm
|
|
<4 mm
|
3
|
0
|
0
|
3
|
0
|
0
|
3
|
|
4-4.9 mm
|
0
|
34
|
1
|
0
|
29
|
6
|
35
|
|
≥5 mm
|
0
|
1
|
26
|
0
|
0
|
27
|
27
|
|
TOTAL
|
3
|
35
|
27
|
3
|
29
|
33
|
65
|
Table 5 - Variation of the observer clear space measurement in the GS x-ray test.
The underline marks the agreement.
Concerning the statistical analysis,
in the Mann-Whitney test a value of 0.000 in group I and 0.005 in group II were obtained,
indicating a very strong evidence of a difference between exposed and unexposed.
Using the Chi-Square test,
there was also a very strong association between the two tests under study with p-value=0.000.
In order to evaluate if there was a linear relationship between the MERS test and the GS test,
the Pearson correlation coefficient was used, having been obtained a value of 0.712,
close to 1,
revealing strong evidence of a direct correlation between the two variables.
[Fig.
7]
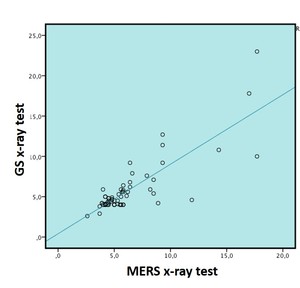
Fig. 7: Linear correlation between the two stress tests: Manual External Rotation Stress (MERS) and Gravity Stress (GS).
References: Isabel Rosa
