Materials & Methods:
- Cross sectional study .
- 30 patients with IPF were included in the study.
- Retrospective study.
Inclusion Criteria:
- P F Ts with evidence of restriction and impaired gas exchange.
- HRCT – bilateral basal reticulation / honeycombing.
- Dyspnea of insidious onset and unknown cause .
- Duration of illness > three months
- Bilateral basal crepitations
- Age older than 35 years.
Exclusion Criteria:
- Individuals with asthma
- Lung disease due to exposures,
drugs,
and connective tissue diseases
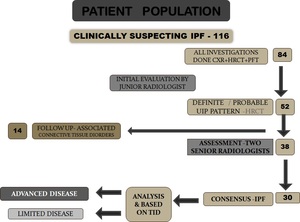
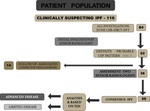
Fig. 1: Patient population
Equipment Used
- Somatom Sensation Siemens 64 slice.
Quark P.F.T.
(Cosmed Italy).
- DATA ANALYSIS: IBM SPSS version 19.0,
for Microsoft windows and Microsoft excel 2007 were used for the statistical analysis in this studySomatom Sensation Siemens (Scan done during breath holding at end of inspiration).
|
PARAMETERS
|
COMMENTS
|
| Areas scanned |
From lung apex to diaphragm |
| Peak voltage |
120 Kvp |
| Section thickness |
1 mm |
| Reconstruction interval |
10 mm |
| Window level |
-500 to -600 HU |
| Window width |
1200 to 1400 |
| Matrix |
512 × 512 pixel |
| Image reconstruction |
High spatial frequency algorithms |
Overall analysis of the HRCT 1,2
- Reticular abnormality
- Honeycombing (cysts < 3 mm / > 3 mm)
- Traction bronchiectasis
- Nodules
- Ground-glass opacities
- Areas of air trapping.
Measurements
- Pulmonary function tests
- DLCO,
- FEV1
- FVC,
- FEV1 /FVC,
- FEF25-75 / FVC,
- Degree of desaturation during six minute walk test.
HRCT EVALUATION
HRCT was evaluated to quantify the extent of interstitial lung involvement,
at five levels with weighted score assigned to each level: (A U Wells et al.3 ;Copley et al.
4; Chan et al.5 )
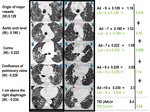
1) Origin of major vessels weight (W) 0.129;
2) Aortic arch level (W) - 0.190
3) Carina (W) - 0.222
4) Confluence of pulmonary veins (W) - 0.228
5) 1 cm above the diaphragm (W) - 0.230.
Estimated pulmonary involvement was calculated using an influence factor ‘weight’ for each of these level (Athol U Wells et al.
6)
Semiquantitative evaluation
- Using a semiquantitative evaluation system,
as previously proposed by Lopes et al.7 each of these levels were analyzed for TID and FIB score
- TID score included reticular abnormality,
honeycombing,
ground-glass opacity and other alterations-Copley et al.4; Lynch et al.8 ; Kazerooni et al.9
0) no alteration;
1) interstitial disease involving ≤ 5% of the area;
2) interstitial disease <25% of the area;
3) interstitial disease <50% of the area;
4) interstitial disease <75% of the area;
5) interstitial disease > 75% of the area.
2.
Score of extent of fibrosis(FIB) 4,8,9
0) No reticular abnormality or honeycombing;
1) Reticular abnormality present but no honeycombing;
2) Honeycombing < 25% of the area;
3) Honeycombing < 50% of the area;
4) Honeycombing < 75% of the area; and
5) Honeycombing >75% of the area.
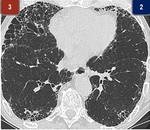
Extent Evaluation in a sample section
1 cm above diaphragm (W) - 0.230

Fig. 2: Extent Evaluation in a sample section
LEFT -2 + RIGHT -3 = 5
TID = 5 x 0.230 = 1.15
2) interstitial disease <25%
3) interstitial disease <50%
Extent Evaluation in a sample case:
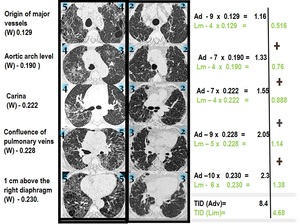
Fig. 3: Extent Evaluation in a sample case
Quark P.F.T.
(Cosmed Italy).
- ATS guidelines of standardized technique of spirometry performance were followed
- Values were expressed as absolute values and,
where appropriate,
as percentages of the predicted values calculated according to sex,
weight and age for our ethnic category.
- Lung function measurements used in this study were obtained concurrently (within one month).
- Arterial oxygen desaturation -A decrease of more than 4% from the baseline saturation was considered significant.
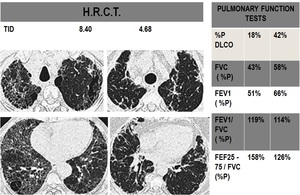
Fig. 4
Statistical Analysis
- Physiologic variables included percentage of predicted DLCO ,FVC,
FEV1,
FEV1/ FVC, FEF25-75 / FVC,
and degree of desaturation during the six minute walk test.
- HRCT variables included mainly overall lung involvement (TID).
Overall fibrosis scores (Fib) and pulmonary artery diameters (P.A.)
- Data management and analysis were performed using IBM SPSS version 19.0.

