METHOD AND MATHERIALS
Twenty-one centers retrospectively collected data related to FT, KAP, and Ka,r for 11 interventional procedures. In total, data for 15200 procedures were collected between 2015 and 2019.
The hospitals were requested to collect data on a sample of at least 20 patients for each procedure. For procedures where data has been provided by more than 10 centers, local DRLs can be obtained. For all other procedures, the median values of distributions are compared with national or literature DRLs.
RESULTS
Figures 1-4 show the distribution of Total KAP by box plots for each procedure; in addition, the figures report the local DRLs or median values obtained in this study compared with ISTISAN DRL [8] and literature DRL [9-17]. Please refer to the published article for additional results [18].
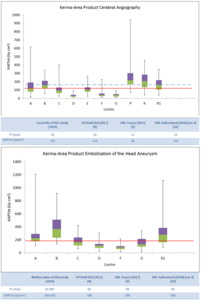
Fig. 1: Box plots of total KAP values for cerebral angiography procedures (top) and embolization in the head for an aneurysm (bottom)in different centres. The continuous line represents the ISTISAN DRL; dashed line represents local DRL of this study.
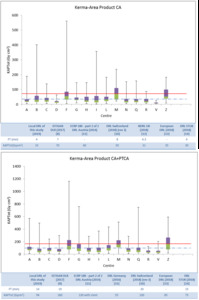
Fig. 2: Box plots of total KAP values for the coronary angiography procedures (top) and coronary angiography + percutaneous transluminal coronary angioplasty procedures (bottom) in the different centres. The continuous line represents the ISTISAN DRL; dashed line represents local DRL of this study.
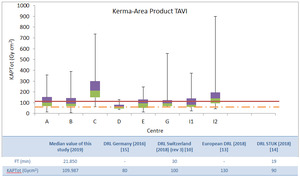
Fig. 3: Box plots of total KAP values for transcatheter aortic valve implantation procedures in the different centres. The continuous line represents the European DRL [13]; the dashed line represents German DRL [15].
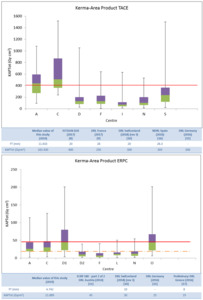
Fig. 4: Top: Box plots of total KAP values for hepatic chemoembolization procedures in the different centres. The continuous line represents the ISTISAN DRL.
Bottom: Box plots of total KAP values for endoscopic retrograde cholangiopancreatography procedures in the different centres. The continuous line represents the Austria’s DRL [11] and the shade line the Greece’s DRL [17]. To improve the graphic representation, KAP values of the center L (472.2 Gycm2 and 619.3 Gycm2) have not been figured.
DISCUSSION
Cerebral Angiography and Embolization of the head aneurysm
The local DRL obtained in this study for cerebral angiography is higher than the value proposed by ISTISAN (Figure 1 top). The local DRL in this case could be seen as a potential update of the ISTISAN DRL.
For Embolization of the head aneurysm it was not possible to obtain the local DRL (Figure 1 bottom).
Centres D, F and G have a significant dose reduction as they are equipped with modern angiographic systems and flat panel dose-reduction systems (RDS).
Table 1 shows the comparison between acquisition and fluoroscopy KAP and reports centres working modalities.
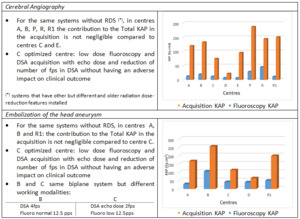
Table 1: Details related to cerebral angiography and embolization of the head aneurysm.
Coronary angiography (CA), Coronary Angiography+ Percutaneous Transluminal Coronary Angioplasty (CA+PTCA) and Transcatheter Aortic Valve Implantation (TAVI)
At national level, CA and CA+PTCA procedures have reached a good level of optimization (Figure 2).
The CA local DRL is lower than the ISTISAN value, comparable with European, UK and Finland’s DRLs [12-14]. The CA+PTCA local DRL is comparable with Swiss and European DRLs.
Centres D, I and V have a dose reduction as they are equipped with modern angiographic systems and flat panel dose-reduction systems (RDS). Table 2 shows the comparison between acquisition and fluoroscopy KAP for CA and reports centres working modalities.
For TAVI procedures we don't have national DRL: the median values of the data collection were compared with literature DRLs, showing in Figure 3 the lowest and the highest value. Figure 3 shows that center C must activate the optimization process. Centres D and I2 have RDS systems.
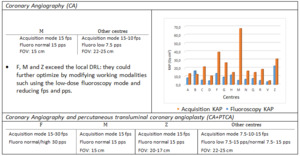
Table 2: Details related to CA and CA+PTCA
Other procedures: Hepatic Chemoembolization (TACE) and Endoscopic Retrograde CholangioPancreatography (ERCP)
For TACE procedures, centres A and C need optimization (Figure 4 top). In this case, however, it would be useful to evaluate the complexity of the procedures as done by Ruiz-Cruces [16]. Table 3 shows acquisition vs fluoroscopy KAP and reports centres working modalities for TACE.
For ERCP procedures we do not have a national DRL: the median values of the data collection were compared with the literature DRLs, showing in Figure 4 (bottom) the lowest and the highest value. The 50% of centres median values is higher than the lower recommended DRL [15]. In this study, in centres where flat panel detector are used, not significant dose reduction were observed.
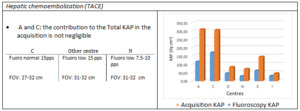
Table 3: Details related to TACE
