DETERMINATION OF RELATIVE FREQUENCIES OF PEDIATRIC X-RAY APPLICATIONS:
For this purpose, pediatric hospitals, private practices and non-pediatric facilities with regular pediatric radiological examinations were identified nationwide. [1] Facilities were considered relevant when they carried out at least 20 applications of at least one specific radiological procedure per year for patients in the age range 0-16 years.
Based on a survey among heads of radiology departments and those responsible in relevant radiological practices, we identified relevant medical facilities for recruitment in the study. 78 institutions completed the survey (table 1).
Table 1: Distribution of institutions participating in the initial survey
|
Institution Type
|
Frequency (%)
|
|
Hospital
|
40 (51.2)
|
|
Practice
|
6 (7.7)
|
|
Network of practices
|
7 (9.0)
|
|
University hospital
|
25 (32.1)
|
|
Total
|
78 (100)
|
Of the 78 facilities, 12 had not carried out pediatric radiological measures with more than 20 applications per year (table 2). The reported frequency depends strongly on the participating department. The pediatric radiological application that was most frequently indicated being carried out at least 20 times was the conventional chest AP / PA radiography. Very few pediatric radiological examinations (teeth / age determination) were reportedly carried out in private practices. One private practice which regularly carried out several pediatric examinations, was affiliated to a hospital.
Table 2: Absolute and relative frequencies of the type of institution with more than 20 pediatric radiological examinations
|
Examination
|
(University)Hospital (n=65)
|
Practice (n=13)
|
Total (N=78)
|
|
x-ray: Brain head ap
|
18 (27.7)
|
0 (0)
|
18 (23.1)
|
|
x-ray: Brain head lat
|
22 (33.8)
|
0 (0)
|
22 (28.2)
|
|
x-ray: Chest ap/pa
|
52 (80)
|
2 (15.4)
|
54 (69.2)
|
|
x-ray: Chest lat
|
30 (46.2)
|
0 (0)
|
30 (38.5)
|
|
x-ray: Abdomen ap/pa
|
45 (69.2)
|
2 (15.4)
|
47 (60.3)
|
|
CT: Abdomen
|
16 (24.6)
|
0 (0)
|
16 (20.5)
|
|
CT: Chest
|
28 (43.1)
|
1 (7.7)
|
29 (37.2)
|
|
CT: Brain head
|
36 (55.4)
|
1 (7.7)
|
37 (47.4)
|
|
MCUG (Micturating cystourethrogram)
|
38 (58.5)
|
1 (7.7)
|
39 (50)
|
|
Kolonkontrasteinlauf
|
27 (41.5)
|
0 (0)
|
27 (34.6)
|
|
Diagnostic angiography
|
9 (13.8)
|
0 (0)
|
9 (11.5)
|
|
Vascular malformation
|
9 (13.8)
|
0 (0)
|
9 (11.5)
|
|
Other
|
47 (72.3)
|
5 (38.5)
|
52 (66.7)
|
|
None
|
4 (6.2)
|
8 (61.5)
|
12 (15.4)
|
From 62 institutions identified and willing to participate in the following collection of frequency data, we obtained information on 1,679,337 relevant examinations. From these, we selected a
set of frequent standard examinations for further data collection on technical parameters relevant to patient dose (Table 3).
Table 3: List of standard examinations, for which dose-relevant parameters were collected
|
Relevant standard examinations CT
|
Relevant standard examinations conventional X-rays
|
|
Knee
|
Pelvis / hip AP
|
|
Cervical spine
|
Cervical spine - AP / PA
|
|
Chest
|
Cervical spine – LAT
|
|
Abdomen
|
AP / PA chest
|
|
Skull
|
Thorax LAT lung
|
|
Temporal bone
|
Abdomen AP / PA
|
|
Whole body
|
Wrist
|
|
Sinus / sinuses
|
Skull AP
|
|
|
Skull LAT
|
|
Relevant standard examinations fluoroscopy / interventional-radiological interventions
|
|
Urinary tract / MCU (micturition-cysto-urography)
|
|
Esophageal swallow
|
|
|
Vascular malformations
|
|
|
Cardiac catheter
|
|
ASSESSMENT OF DOSE-RELEVANT TECHNICAL PARAMETERS:
Data collection of the technical examination parameters of the selected radiological applications covered a continuous period of 24 months (01/07/2016 to 30.06.2018). Data collection from different sources was based on standard operating procedures for the Picture Archive System (PACS), the dose management systems (DMS) and the radiological information system (RIS).
Protocol descriptions were mapped to standard examinations based on the classification scheme from the 154th guideline of the European Commission (2), adapted to the purposes of this study. The algorithm extracted information on the modality, the body region, and specific examination type.
Scanner parameters stored in a PACS system were queried using custom-built software, the Java-based PACSSeriesQueryTool. The data collection from a DMS was based on several manual exports in DMS-specific format. If data collection was not possible via the PACS or via a DMS, data was collected via the RIS or an excel template.
Results
Data on technical scanner parameters were collected from 21 institutions. 4 data sets came from a DMS, 9 from a PACS, 7 from a RIS, and 1 data set was collected by excel template. 9 data
sets came from a university medical center, 11 from other hospitals and 1 data set represented combined data from several physicians. The structure of the data sets and the documented parameters exhibited high heterogeneity.
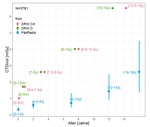
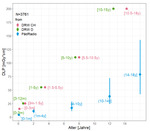
Data from 13,513 CT series, 144,524 conventional radiology examinations, and 7,594 fluoroscopy examinations were collected. As a sample result, among 4,268 chest CT, 760 were for 10-14 year old patients. 701 of these CT scans had parameter data available. Among these, the distribution’s third quartile was 2.5 for CTDIvol and 71 for DLP – considerably lower than current DRL that specify 6.5 CTDIvol and 200 DLP (See also figure 1 and 2.).
Figure 1: CTDIvol of CT chest examinations separated by age group together with DRW from Germany and Switzerland. Results for PädRadio show the median of the distribution of parameter values (represented as a point), as well as the range from the 1st to the 3rd quartile (shown as a vertical line).


