Methods
We conducted a quality improvement project to determine the optimal FoV for a CT KUB examination and assess whether this is being followed. We also collected radiation dose data.
Over a three-month period, CT KUB examinations completed by a single Aquilion ONE CT scanner (Canon Medical Systems, Otawara, Japan) at a UK National Health Service (NHS) district general hospital were included in the study.
For each study, the following data items were collected:
- Vertebral level at which the superior-most kidney is fully included
- Vertebral level at which the scan ended
- Level at which the scan commenced
- Measurement of patient dose values
The images were displayed on InSight PACS (Insignia Medical Systems, Basingstoke, UK). The above data items were collected onto an Excel (Microsoft, Redmond, WA, USA) spreadsheet.
Inclusion criteria:
· CT KUB performed where the clinical indication was renal colic
· Patient age >16 years
· Single Aquilion ONE scanner used
Exclusion criteria:
· >1 scan protocol required in a single session (e.g. CT KUB and CT urogram)
· Extreme body habitus
Results
At the end of the study period, 125 scans met the criteria for inclusion in the study.
Objective 1: Vertebral level at which the superior-most kidney is fully included
The average level at which the superior-most kidney was fully included was T12/L1. In 59.2% of cases both the kidneys were included by T12, 25.6% by L1, 13.6% by T11 and only 1.6% at T10 vertebral level. Therefore, the highest vertebral level at which both the kidneys were fully included in this study was T10.
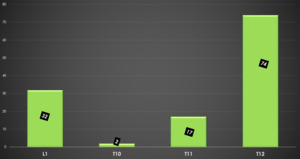
Fig. 1: Chart showing the vertebral level at which the superior-most kidney is fully included
References: Department of Radiology, Colchester General Hospital
Objective 2: Vertebral level at which the scan ended
The average vertebral level at which the scan ended was T11/T12 with 49.6% of scans ending at T11, 32% of scans ending at T12, 13.6% ending at T10, 0.8% ending at L1 and 4% of scans ended above T10. One scan ended at T8 and four ended at the T9 vertebral level. Therefore, overall 96% of scans ended at the T10 level.
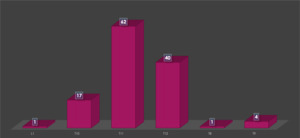
Fig. 2: Chart showing the vertebral level at which the scan is terminated
References: Department of Radiology, Colchester General Hospital
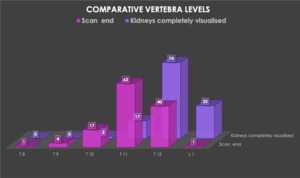
Fig. 3: Comparative Vertebral Levels of Kidney Superior Pole Visualisation and Scan Termination
References: Department of Radiology, Colchester General Hospital
Objective 3: Level at which the scan commenced
The majority of scans commenced at the level of lesser trochanter accounting for 46% of all cases. 15% of the scans commenced at the level of the pubic symphysis and 39% below the lesser trochanter. The base of the urinary bladder was completely included by the level of pubic symphysis in all scans.
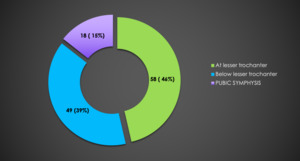
Fig. 4: Level of Scan Commencement
References: Department of Radiology, Colchester General Hospital
Objective 4: Measurement of patient dosage values
The average CTDI (vol) patient dose was 2.5 mGy; DLP was 118.20 mGy/cm. National guidelines suggest 10mGy and 460 mGy/cm, respectively.
Radiation doses for scans that included the T9 and T8 vertebrae were notably higher than those that terminated at T10.
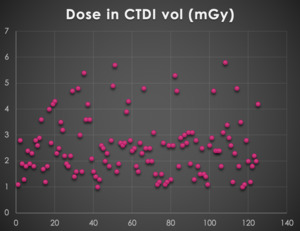
Fig. 5: Dose in CTDI (vol) (mGy)
References: Department of Radiology, Colchester General Hospital
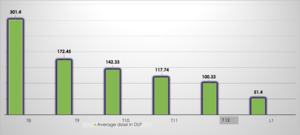
Fig. 6: Radiation dose in relation to vertebral level at which the scan is terminated (dose-length product - mGy.cm)
References: Department of Radiology, Colchester General Hospital
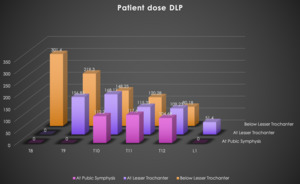
Fig. 7: Chart showing the relationship between the level of scan commencement, scan termination and radiation dose.
References: Department of Radiology, Colchester General Hospital
