We performed a retrospective study of consecutive patients with intracranial coils who had undergone brain imaging at a Philips dual-layer IQon CT at our centre between November 21, 2017 and April 4, 2019. Patients with and without O-MAR reconstructions were included. The patients (n=38) were grouped and analyzed separately based on if O-MAR reconstructions were available (n=6) or not (n=32).
Objective image analysis: Regions of interests (ROIs) were placed in specific locations; artifact free white matter and artifact affected white matter distal and proximal to the metal.
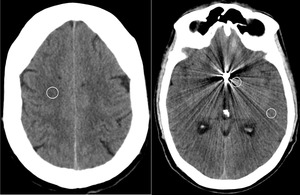
Fig. 1: Example of placement of circular regions of interest (ROIs) in artifact free white matter (left image) as well as proximal and distal to the metal coils (right image) in a patient treated for an aneurysm in the anterior communicating artery.
The ROI's were used to collect mean attenuation values (HU) and standard deviations (SD) in both conventional (CI) and, through spectral diagrams, for monoenergetic reconstructions (VMIs) ranging from 40 to 200 keV with 10 keV increments. Median attenuation and signal to noise-values (HU/SD) were compared. All measurements were performed in axial plane images with a slice thickness of 4 mm.
Subjective image analysis: A qualitative analysis was performed through visual grading of CIs and VMIs at 40-60, 80, 120 and 140 keVs in the Viewdex software (Viewer for Digital Evaluation of X-ray images (5, 6) by two independent viewers blinded to reconstrucion type. The viewers rated metal artifact severity, overall image quality and grey-white matter discrimination on a 5-point Likert scale (1=Massive artifacts/Non diagnostic, 2=Severe artifacts/Poor, 3=Moderate artifacts/Fair, 4=Minor artifacts/Good and 5=No artifacts/Excellent).
In artifact-affected tissue distal of the metal, the median attenuation values in higher keVs generally approached the values of CI artifact free tissue, both with and without O-MAR. Median SNR values in tissue distal of the artifact peaked at 70 keV for the non-OMAR group and at 90 keV when OMAR was applied(figure 2).
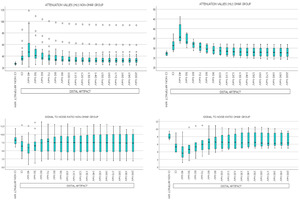
Fig. 2: Top row: Box plots of attenuation values in Hounsfield units (HU) for artifact free white matter (WM) in conventional images (CI) followed by artifact affected WM of CI and virtual monoenergetic images (VMI's) from 40-200 keV. Values of non-OMAR group (left) and OMAR group (right).
Bottom row: Box plot of signal to noise-values for artifact free WM in conventional images (CI) followed by artifact affected WM of CI and VMI's from 40-200 keV. Values of non-OMAR group (left) and OMAR group (right).
Results of the subjective analysis can be viewed in figure 3.

Fig. 3: Top row: Bar charts of Overall image quality score assessed by viewer 1 and 2 respectively in the non-OMAR group (left) and OMAR group (right).
Middle row: Bar charts of Grey-white matter discrimination score assessed by viewer 1 and 2 respectively in the non-OMAR group (left) and OMAR group (right).
Bottom row: Bar charts of Metal artifact severity assessed by viewer 1 and 2 respectively in the non-OMAR group (left) and OMAR group (right).
Mean artifact severity score in the non-OMAR group peaked at 50 keV for viewer 1 and at 70 keV for viewer 2. The mean values of those reconstructions were higher than the mean value of the conventional images for both viewers respectively. The interobserver agreement for the evaluation of artifact severity was calculated as a weighted Cohens kappa coefficient and was moderate at 0,57. In the OMAR group, the artifact severity was generally assessed as lower copared to same images without OMAR for all reconstructions (figure 4).
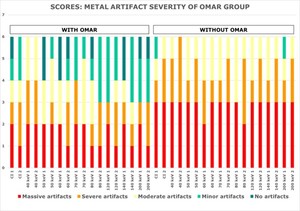
Fig. 4: Bar graph of metal artifact severity scores of OMAR group. Same patient material both with and without application of OMAR. Proportion of scores where bars represent reconstruction type and viewer 1 and 2 respectively.

 in artifact free white matter (left image) as well as proximal and distal to the metal coils (right image) in a patient treated for an aneurysm in the anterior communicating artery.")
 for artifact free white matter (WM) in conventional images (CI) followed by artifact affected WM of CI and virtual monoenergetic images (VMI's) from 40-200 keV. Values of non-OMAR group (left) and OMAR group (right).
Bottom row: Box plot of signal to noise-values for artifact free WM in conventional images (CI) followed by artifact affected WM of CI and VMI's from 40-200 keV. Values of non-OMAR group (left) and OMAR group (right).")
 and OMAR group (right).
Middle row: Bar charts of Grey-white matter discrimination score assessed by viewer 1 and 2 respectively in the non-OMAR group (left) and OMAR group (right).
Bottom row: Bar charts of Metal artifact severity assessed by viewer 1 and 2 respectively in the non-OMAR group (left) and OMAR group (right).")
