ECR 2007 / C-299
Imaging biomarkers in colorectal cancer: Texture analysis of hepatic CT
Congress:
ECR 2007
Poster Number:
C-299
Type:
Scientific Exhibit
Keywords:
Authors:
B. Ganeshan1, K. A. Miles2, R. C. D. Young1, C. R. Chatwin1; 1Falmer/UK, 2Brighton/UK
DOI:
DOI-Link:

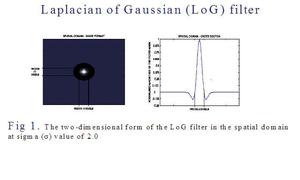
Fig. 1

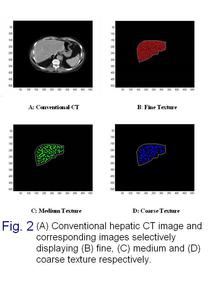
Fig. 2

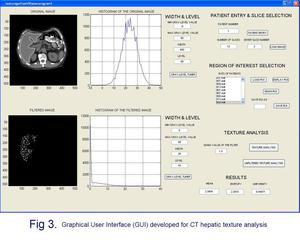
Fig. 3