ECR 2009 / C-577
Dual X-ray absorptiometry (DXA): A comprehensive review
Congress:
ECR 2009
Poster Number:
C-577
Type:
Educational Exhibit
Keywords:
Authors:
R. M. Lorente-Ramos, Y. del Valle-Sanz, F. J. Azpeitia-Armán, J. Acosta-Batlle; Madrid/ES
DOI:
10.1594/ecr2009/C-577
DOI-Link:

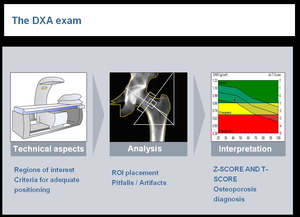
Fig. 1:
DXA Exam steps

Fig. 2

Fig. 3

Fig. 4

Fig. 5

Fig. 6

Fig. 7

Fig. 8

Fig. 9

Fig. 10

Fig. 11

Fig. 12

Fig. 13

Fig. 14

Fig. 15

Fig. 16

Fig. 17

Fig. 18

Fig. 19

Fig. 20

Fig. 21

Fig. 22

Fig. 23

Fig. 24

Fig. 25

Fig. 26

Fig. 27

Fig. 28

Fig. 29