Anatomy of the hip
Anterior and posterior acetabular rims
On AP views,
the anterior and posterior acetabular rims (figure 1A) project on the femoral head.
In a particularly anteverted acetabulum,
the anterior rim projects on the upper aspect of the femoral head,
which may mimic subcondral fracture or avascular necrosis (figure 1B).
In coxa profunda (figure 1C) or hip osteoarthritis,
the posterior acetabular rim may project on the head-neck junction line,
which should not be misinterpreted as an impacted subcapital fracture.
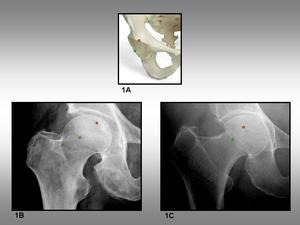
Fig. 1: Anterior and posterior acetabular rims. 1A, Pelvic bone showing the position of the anterior (red circle) and posterior (green circle) acetabular rims. 1B, Anteroposterior radiograph of the hip shows the anterior (red circle) and posterior (green circle) acetabular rims. 1C, Anteroposterior radiograph of a coxa profunda shows the same anterior (red circle) and posterior (green circle) lines.
Acetabular notch
The acetabular notch,
at the caudal aspect of the acetabulum,
is continuous with a circular non-articular depression,
the acetabular fossa (figure 2A).
The margins of the notch serve for the attachment of the ligamentum teres.
The rest of the acetabulum is formed by a curved articular surface,
the lunate surface.
On AP radiographs,
the posterior rim of the acetabular notch,
more prominent than the anterior rim,
commonly projects on the inferior aspect of the femoral head (figure 2B).
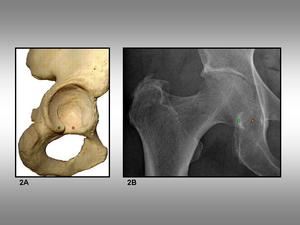
Fig. 2: Acetabular notch. 2A, Acetabulum view shows the acetabular notch (red circle) and its posterior rim (green circle). 2B, Anteroposterior plain film of the hip shows the posterior rim (green circle) and the approximate position of the notch (red circle).
Head-neck junction
The morphology and configuration of the head-neck junction is highly variable.
On AP views,
the head-neck junction line is usually irregular or incomplete (figure 3A).
On axial views,
the superior contour of the greater trochanter,
corresponding to the upper limit of the lateral and superoposterior facets,
projects near the head-neck junction,
which should not be misinterpreted as a subcapital impacted fracture.
The line of the greater trochanter is followed by the posterior trocanteric crest,
and the quadrate tubercle (figure 3B).
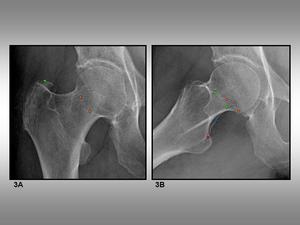
Fig. 3: Head-neck junction. 3A, Anteroposterior view of the hip shows the head-neck junction (orange circle) and the superior contour of the greater trochanter (green circle). 3B, Axial view of the hip shows the head-neck junction (orange circle), the superior contour of the greater trochanter (green circle), the posterior trochanteric crest (blue circle) and the quadrate tubercle (pink circle).
Trabecular pattern
Trabecular pattern lines include the following groups: main tension group,
main compression group,
secondary tension group,
secondary compression group,
greater trochanter group,
Ward triangle,
and calcar (figures 4A and 4B).
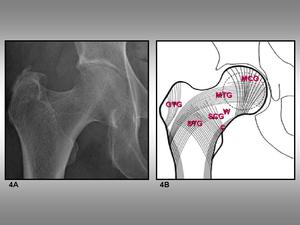
Fig. 4: Trabecular pattern groups. 4A, Anteroposterior view of the hip. 4B, Schematic representation of the groups seeing on 4A: MTC, MCG, STG, SCG, GTG, W, and C stands for main tension group, main compression group, greater trochanter group, Ward triangle, and calcar, respectively.
Soft-tissue folds
Identification of soft-tissue folds around the head-neck junction,
femoral neck and trochanteric region is usually straightforward.
However,
these folds may ocasionally mimic or distract from true fractures (figures 5A,
5B,
and 5C).
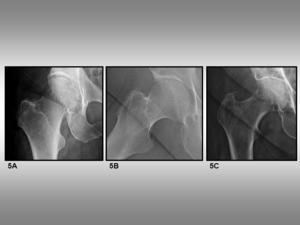
Fig. 5: Soft-tissue folds. 5A, Inguinal fold projecting on head-neck junction. 5B, Inguinal fold projecting on intertrochanteric region. 5C, Abdominal contour and inguinal fold.
Subtle and misleading fractures of the proximal femur
Osteochondral fractures of the femoral head
Osteochondral fractures and impactions of the femoral head almost always result as an associated injury in a more complex hip traumatism.
Radiographs may show some findings such as bony fragments or impactions,
but frequently these are overlooked because of other associated fractures (figure 6A) and dislocation complexity (figure 7A).
CT can be useful to assess fractures of the femoral head,
presence or not of osteochondral impactations,
joint congruency,
and other findings such as possible associated acetabular fractures (figures 6B and 7B).
MRI is also very accurate in detecting osteochondral impaction fractures apart from assessing soft tissue injuries.
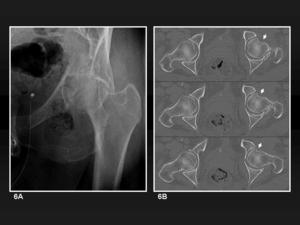
Fig. 6: Acetabular fracture and osteochondral fracture of the femoral head. 6A, Anteroposterior plain film shows a complex acetabular fracture. Superposition of debris makes impossible to define femoral head lesions. 6B, MDCT axial images show an osteochondral fracture not observed on radiographs (white arrows).
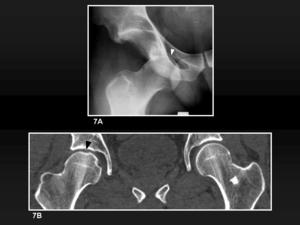
Fig. 7: Hip dislocation and osteochondral impaction of the femoral head. 7A, Anteroposterior plain film shows an anterior dislocation of the femoral head. A radiolucent line (white arrowhead) is the only finding which delates a head fracture. 7B, MDCT coronal reformatted image shows an osteochondral impaction (black arrowhead).
Subchondral fractures of the femoral head
Subchondral insufficiency fractures of the femoral head occur in absence of major trauma because of cortical bone weakening,
which may appear in osteoporotic overweight patients,
renal transplant recipients and also in athletes.
Most of plain radiographs do not show any finding during the first 3 months.
After this period they may show mixed altered radiodensity,
superolateral collapse of the femoral head,
and,
occasionally,
rapid destruction of the hip joint.
Bone scintigraphy may demonstrate an increased uptake of the femoral head.
MR imaging shows bone marrow edema of the femoral head and neck in T2-weighted sequences and a subchondral hypointense wavy line on T1-weighted sequences.
Stress fractures of the femoral neck
Most stress fractures of the femoral neck are incomplete.
They are usually occult fractures as they remain as non-displaced.
At early stages plain film radiographs may show no changes (figure 8A).
After progression plain films may show some findings such as trabecular interruption,
cortical radiolucency,
callus formation and partial or complete fracture line without displacement.
Computed tomography examinations show an incomplete fracture line surrounded by sclerotic bone (figure 8B).
MR imaging findings include an incomplete fracture line surrounded by intraosseous edema (figure 8C).
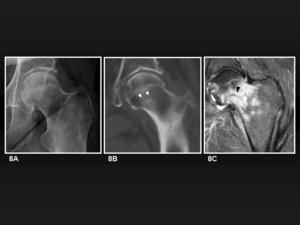
Fig. 8: Stress fracture of the femoral neck. 8A, Anteroposterior radiograph shows no fracture line. 8B, MDCT coronal reformatted image shows an sclerotic line partially traversing the femoral neck from its inferior aspect (white arrowheads). 8C, Coronal T2-weighted fat satturated MR image for the same patient shows femoral neck edema as hyperintensity and a hypointense fracture line following the same direction as in 8B (black arrowhead).
Minimally impacted subcapital fractures
According to Garden classification,
femoral neck fractures may be non-displaced (types I and II) or displaced (types III and IV).
Garden type I fractures include non-displaced,
slighty impacted with the femoral head tilted into valgus and distal fragment in external rotation.
Conventional radiograph of the pelvis shows the vast majority of subcapital fractures (figure 9A).
Other additional views,
as for example anteroposterior view of the hip in internal rotation,
may be necessary to demonstrate minimally displaced femoral neck fractures.
CT is not used for standard assessment of the femoral neck fractures.
However it may show non-displaced or minimally impacted femoral neck fractures (figure 9B).
This is important in high-risk patients such as those with associated fractures of the acetabulum or distal femoral shaft.
CT also may be useful for assessment of other details such as angulation of fragments (figure 10A and 10B).
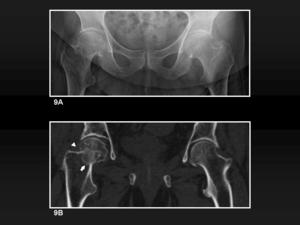
Fig. 9: Minimally impacted subcapital fracture. 9A, Plain film shows a shortened right neck. 9B, MDCT coronal reformatted image of the same patient demonstrate also a sclerotic impaction line (white arrow) and an approximation between the head and the greater trochanter as a result of the valgus deviation (white arrowhead).
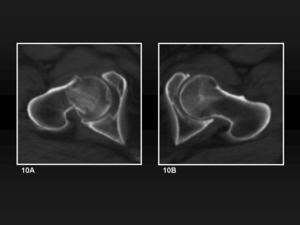
Fig. 10: Minimally impacted subcapital fracture. 10A, MDCT axial image of the affected head and comparative image of the other hip (10B), evidence the impaction and also a tilt into posterior of the femoral head.
Non-displaced intertrochanteric fractures
The anteroposterior view of the pelvis allows detection of most intertrochateric fracture lines,
and comparison with the other side.
In non-displaced fractures,
dubious or subtle lines (figure 11A) may be demonstrated with other views such as hip in internal rotation,
or even with crossectional imaging.
Consequences of an incorrect treatment include displacement of the fragments (figure 11B).
CT scans are frequently used to plan surgical treatment rather than to add diagnostic information to the plain film studies.
However,
they also may be useful to the diagnosis of complications such as nonunions (figure 12).
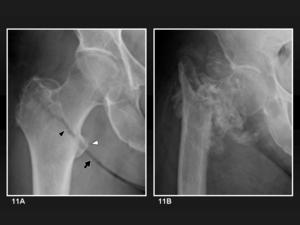
Fig. 11: Non-displaced intertrochanteric fracture. 11A, Anteroposterior radiograph shows an non-displaced intertrochanteric fracture line (black arrowhead) continued with the inguinal fold line (black arrow). The crossing corticals on the lesser trochanter shadow are (white arrowhead) a subtle but clear fracture sign. 11B, Anteroposterior radiograph of the same hip two months later without the correct treatment shows that a marked displacement and lots of bone debris have formed between the fragments.
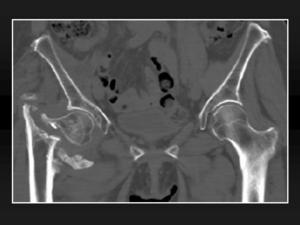
Fig. 12: Non-displaced intertrochanteric fracture. 12, MDCT coronal reformatted image of the previous patient two months later shows there exists displacement of the fragments and a failure in bone union.
Non-displaced trochanteric avulsion fractures
The anteroposterior view of the pelvis with o without other views of the affected hip enables direct diagnosis of the displaced fractures.
Non-displaced fractures may be easily overlooked (figure 13A) and misinterpreted in plain films.
CT may be use to confirm or clarify the dubious cases (figure 13B and 14).
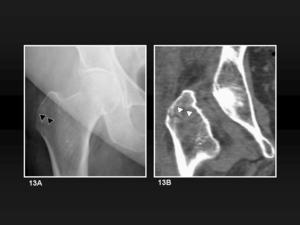
Fig. 13: Non-displaced greater trochanter avulsion fracture. 13A, Anteroposterior radiograph shows a subtle radiolucent line from the external surface of the greater trochanter (black arrowheads). There is no fragment displacement. 13B, MDCT coronal reformatted image confirms that there is no displacement but also demonstrates that the line traverses completely the greater trochanter (white arrowheads).
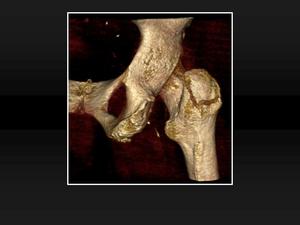
Fig. 14: Non-displaced greater trochanter avulsion fracture. 14, Volume rendering reconstruction from the previous patient shows the contour of the non-displaced fracture from a posterior view.
Pathologic fractures
Pathologic fractures are those due to any type of stress in a bone previously weakened by another process (usually neoplasia or infection).
To determine whether a fracture is or not pathologic may be a difficult task.
If the weakening process is a neoplasia,
findings may include osteolytic and osteoblastic lesions in other non-fractured bones (figure 15),
permeative pattern of bone destruction and periosteal response.
However,
preexisting lesions in plain films may be overlooked if they are destroyed during the trauma.
MR imaging findings may be employed to assess the different signal of the fracture components to gain information about their nature.
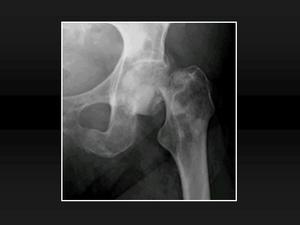
Fig. 15: Pathologic fracture. 15, Anteroposterior plain radiograph shows a displaced subcapital femoral neck fracture with multiple osteoblastic metastases from breast carcinoma.

 and posterior (green circle) acetabular rims. 1B, Anteroposterior radiograph of the hip shows the anterior (red circle) and posterior (green circle) acetabular rims. 1C, Anteroposterior radiograph of a coxa profunda shows the same anterior (red circle) and posterior (green circle) lines.")
 and its posterior rim (green circle). 2B, Anteroposterior plain film of the hip shows the posterior rim (green circle) and the approximate position of the notch (red circle).")
 and the superior contour of the greater trochanter (green circle). 3B, Axial view of the hip shows the head-neck junction (orange circle), the superior contour of the greater trochanter (green circle), the posterior trochanteric crest (blue circle) and the quadrate tubercle (pink circle).")


.")
 is the only finding which delates a head fracture. 7B, MDCT coronal reformatted image shows an osteochondral impaction (black arrowhead).")
. 8C, Coronal T2-weighted fat satturated MR image for the same patient shows femoral neck edema as hyperintensity and a hypointense fracture line following the same direction as in 8B (black arrowhead).")
 and an approximation between the head and the greater trochanter as a result of the valgus deviation (white arrowhead).")
, evidence the impaction and also a tilt into posterior of the femoral head.")
 continued with the inguinal fold line (black arrow). The crossing corticals on the lesser trochanter shadow are (white arrowhead) a subtle but clear fracture sign. 11B, Anteroposterior radiograph of the same hip two months later without the correct treatment shows that a marked displacement and lots of bone debris have formed between the fragments.")

. There is no fragment displacement. 13B, MDCT coronal reformatted image confirms that there is no displacement but also demonstrates that the line traverses completely the greater trochanter (white arrowheads).")

