We retrospectively analyzed MR brain images in three autopsy-proven cases (an 81-year-old man with normal neuropathological findings,
an 81-year-old man with DLB,
and a 68-year-old woman with PD).
After obtaining consent from the relatives,
we conducted postmortem examination of these brains.
All aspects of this retrospective study were approved by the institutional review board at our institution.
Established DLB neuropathological criteria were applied [8,
9] for neuropathological diagnosis of PD and DLB.
We checked for the presence of Lewy bodies with neuronal loss and gliosis in several structures including the anterior olfactory structures,
lower raphe nuclei,
LC,
substantia nigra,
amygdala,
nucleus basilis of Meynert,
temporal mesocortex,
temporal neocortex,
sensory association and premotor areas,
and primary sensory and motor areas.
Lewy bodies were stained using alpha-synuclein immunohistochemistry.
NmMRI of 10% -formalin-fixed autopsied brains (postmortem NmMRI) was obtained in all cases using a 3T imaging system,
Signa Excite HD (GE Healthcare,
Milwaukee,
WI,
USA).
First,
we washed the fixed brains in running tap water for 24 consecutive hours.
For gross examination,
3-mm-thick axial sections of each brain stem were obtained.
The fixed 3-mm-thick sections of the upper midbrain were positioned over a surface coil 2 inches in diameter.
The pulse sequences used were the T1-weighted 3D-spoiled gradient echo technique with a repetition time of 25 ms,
echo time of 3.4 ms,
a flip angle of 20 degrees,
field of view of 80 mm,
matrix size of 384 × 384 (pixel size of 0.2 × 0.2),
slice thickness of 0.8 mm,
and excitation number of four times.
Magnetization transfer contrast pulse was also applied.
Acquisition time was 7.6 min.
For MR-pathologic direct correlation,
neuropathological examinations were performed in all cases using three staining methods: hematoxylin and eosin,
Klüver-Barrera,
and ferritin immunohistochemistry.
The Klüver-Barrera method was used to evaluate myelin,
and ferritin immunohistochemistry was used to reveal ferritin deposits.
Although antemortem conventional MR images such as T1-weighted and T2-weighted images were obtained,
antemortem NmMRI was not obtained in all cases.
However,
hyperintense lesions on postmortem T1-weighted images are qualitatively well correlated with the in vivo imaging findings [13,
14] despite a reversal of grey/white matter contrast due to shortening of T1 and T2 relaxation times,
secondary to formalin fixation [15,
16].
Postmortem NmMRI and histological correlations in the SNc
The presence of signal changes in the SNc was evaluated on postmortem NmMRI.
The signal changes in the SNc were compared to those in the superior colliculus (SC) in each case.
Also,
the signal changes in the SNc were compared to the neuropathological findings,
focusing on neuromelanin-containing neurons,
myelinated fibers,
and ferritin depositions in each case.
Evaluation of the signal intensity and number of neuromelanin-containing neurons in the SNc
The SNc on NmMRI in each case was divided into four parts (1: right lateral,
2: right medial,
3: left medial,
4: left lateral) (Fig.
1).
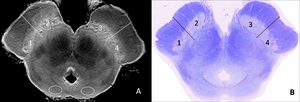
Fig. 1: Measurement of NmMRI and myelin-stained sections.
A. Postmortem NmMRI of the midbrain (case 1; normal control).
The SNc is clearly identified as band-like hypersignal areas in the posterior portion of the cerebral peduncle. Each side of the SNc is divided into medial and lateral parts, and therefore, the SNc is divided into four parts (1: right lateral, 2: right medial, 3: left medial, 4: left lateral). Bilateral SCs are also shown (dotted lines).
B. A myelin-stained (Klüver-Barrera stain) section corresponding to (A) (case 1).
The SNc is divided into four similar parts. The number of neuromelanin-containing neurons was counted in each part of the SNc in all cases.
The contrast ratio of each part of the SNc was measured by defining the region of interest (ROI) on a liquid crystal display following the equation: SSNc−SSC/SSC,
where SSNc is the signal intensity of the SNc,
and SSC is the signal intensity of the SC.
ROIs were placed in the four parts of the SNc in each one of the three specimens and strictly traced according to the margins of the anatomical regions.
All images were analyzed by two experienced neuroradiologists (S.K,
E.M).
The SNc on myelin-stained (Klüver-Barrera stain) sections in each case was similarly divided into four parts (Fig.
1).
The number of neuromelanin-containing neurons was counted manually in each part of the SNc under a light microscope in all cases.
Statistical analysis
Furthermore,
the correlation between signal intensity and number of neuromelanin-containing neurons was evaluated using linear regression analysis in all cases.
The contrast ratios of the signal intensity of the SNc in the normal,
DLB,
and PD cases were compared using the Kruskal-Wallis test with Tukey post -hoc analysis.
The significance level was 0.05.


.
The SNc is clearly identified as band-like hypersignal areas in the posterior portion of the cerebral peduncle. Each side of the SNc is divided into medial and lateral parts, and therefore, the SNc is divided into four parts (1: right lateral, 2: right medial, 3: left medial, 4: left lateral). Bilateral SCs are also shown (dotted lines).
B. A myelin-stained (Klüver-Barrera stain) section corresponding to (A) (case 1).
The SNc is divided into four similar parts. The number of neuromelanin-containing neurons was counted in each part of the SNc in all cases.")