General aspects about amyloidosis
Amyloidosis is a disease in which an insoluble amyloid protein fibril deposits mainly in the extracellular spaces of organs and tissues.
Amyloid fibril proteins are rigid,
non-branching fibrils approximately 10 nm in diameter.
The fibrils bind the dye Congo red and exhibit green birefringence when viewed by polarisation microscopy.
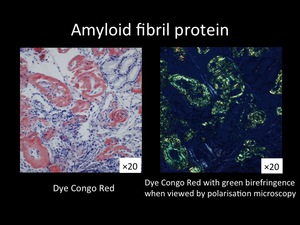
Fig. 1
To date,
there are 27 known extracellular fibril proteins in humans (1).
There are two classifications of amyloidosis,
systemic and localized.
Definition of cardiac amyloidosis
Amyloid deposition in the myocardium,
conduction pathway,
and coronary vessels is called cardiac amyloidosis.
There are 4 types of systemic amyloidosis and one localized amyloidosis in CA.
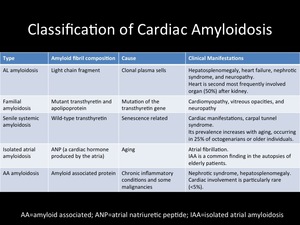
Fig. 2
CA has a poor prognosis,
early recognition can improve the prognosis,
helping to insure the administration of aggressive medical treatment.
However,
due to unspecific symptoms,
the diagnosis of CA is difficult.
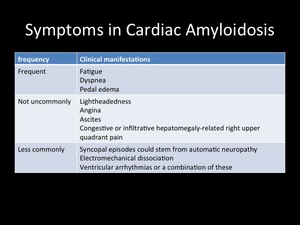
Fig. 3
The diagnosis of CA is established by direct endomyocardial biopsy or indirect investigation and histologic confirmation of amyloid on noncardiac tissue.
Invasive
- abdominal fat pad aspiration: positive in 50-80% AL type.
- endomyocardial biopsy: gold standard.
- bone marrow biopsy: positive in 50% AL type.
Non-Invasive
- Electrocardiogram; low voltage,
pseudoinfarction pattern
- Echocardiogram; increased cardiac wall thickness,
‘granular sparkling’ appearance of the myocardium.
However,
this is not specific.
- 99mTc-DPD scintigraphy; Accumulation is seen only in TTR-related CA (2).
Role of CMR in Cardiac Amyloidosis (3)
1.
Comprehensive exam
- Morphology
- Function
- Tissue characterization
2. Sensitive tool to detect the amyloid deposit
- LGE can identify cardiac involvement before morphologic abnormalities manifest
- LGE is associated with the worst clinical states
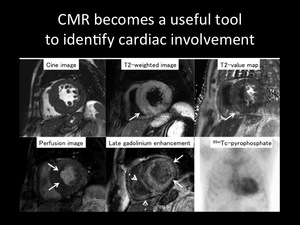
Fig. 4: Representative images of 67-year-old female diagnosed with CA.
Upper left: Cine image shows obvious myocardial thickness in the septum.
Upper middle: T2-weighted image shows high signal intensity in the postero-septal junction (arrow).
Upper right: T2 map shows increased T2 value in the postero-septal junction (arrow).
Lower left: Perfusion image shows delayed myocardial blood flow in the endomyocardium (arrow).
Lower middle: Late gadolinium enhancement image shows global endomyocardial enhancement in the left ventricle (arrow) as well as the right ventricle (dashed arrow).
Lower right: Increased uptake in the myocardium is seen on 99mTc-pyrophosphate scintigraphy.

.
Upper right: T2 map shows increased T2 value in the postero-septal junction (arrow).
Lower left: Perfusion image shows delayed myocardial blood flow in the endomyocardium (arrow).
Lower middle: Late gadolinium enhancement image shows global endomyocardial enhancement in the left ventricle (arrow) as well as the right ventricle (dashed arrow).
Lower right: Increased uptake in the myocardium is seen on 99mTc-pyrophosphate scintigraphy.")