This educational exhibit shows
- A review of typical CMR findings such as cine,
T2WI,
T2 map,
perfusion,
and late gadolinium enhancement (LGE).
This exhibit will especially focus on LGE.
- Tips and pitfalls of CMR in acquisition and interpretation.
The techniques are described and illustrated.
Morphological finding
Concentric and symmetrical hypertrophy is frequent in CA in contrast to hypertrophic cardiomyopathy,
which presents asymmetrical hypertrophy.
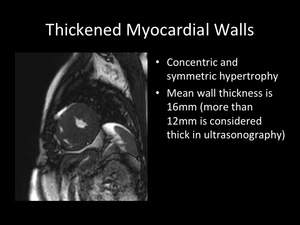
Fig. 5
Understanding morphological change helps to diagnose in CA when extra-cardiac histo-pathological evidence can be obtained by abdominal fat pad aspiration or duodenal biopsy.
Moreover there is a relation between the wall thickness and the prevalence of heart failure (4).
Functional analysis
Diastolic function is decreased prior to the decrease of systolic function.
Diastolic function can be assessed correctly by CMR (5).
Diastolic function can be assessed by
- Time-volume curve of left ventricle analysis assessed by cine imaging (Fig.6)
- Flow analysis at mitral valve assessed by phase-contrast imaging (Fig.7)
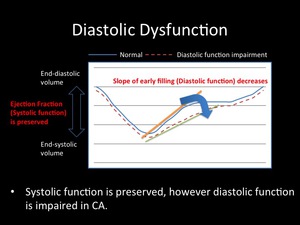
Fig. 6: Systolic function is preserved, however diastolic function is impaired in CA.
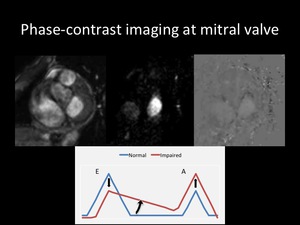
Fig. 7
T2-weighted imaging (T2WI) and T2 mapping
T2WI can reveal the increase of the water component in the diseased myocardium.
On the other hand,
amyloid fibrils make T2 relaxation time shorter because of high molecular weights.
Myocardial edema was reported in 10% of CA patients.
Conventional T2WI on CMR has some limitations; 1) signal intensity variability caused by phased array coils,
2) high signal from slow moving ventricular chamber blood that can mimic and mask elevated T2 in the myocardium,
and 3) motion artifacts.
To overcome these limitations,
T2 mapping is preferable.
T2 relaxation time in CA was comparable with normal controls (6).
This is explained by
- reduced proton density
- enhanced T2 decay due to the fixed position of amyloid protons in the beta pleated sheet proton structure
- spin-spin interactions between amyloid and adjacent water protons leading to dephasing
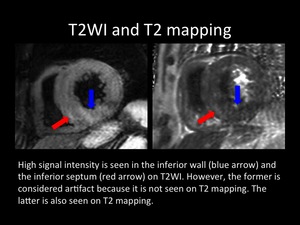
Fig. 8: High signal intensity is seen in the inferior wall (blue arrow) and the inferior septum (red arrow) on T2WI. However, the former is considered artifact because it is not seen on T2 mapping. The latter is also seen on T2 mapping.
Perfusion imaging
About one-third of CA demonstrates subendocardial abnormalities on rest perfusion imaging (6).
This is presumed that these perfusion defects reflect
- subendocardial amyloid deposition
- infiltration of small-caliber coronary vessel walls by amyloid
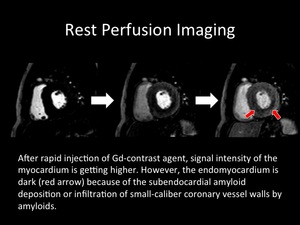
Fig. 9: After rapid injection of the Gd-contrast agent, the signal intensity of the myocardium is getting higher. However, the endomyocardium is dark (red arrow) because of the subendocardial amyloid deposition or infiltration of small-caliber coronary vessel walls by amyloids.
Inversion time scouting (TI scout)
The kinetic of the gadolinium contrast agent of CA is known to be different from normal hearts and hearts with other cardiac diseases.
The T1 relaxation time in myocardium is similar to that in blood,
and the blood gadolinium clearance was faster in CA (7).
As a result,
inversion time (TI) of the myocardial nulling is faster than that of the blood pool in contrast to other diseases such as myocardial infarction.
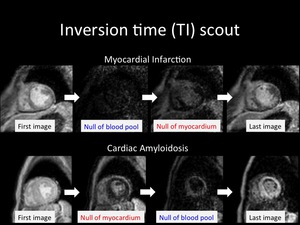
Fig. 10: Inversion time (TI) of the myocardial nulling is faster than that of the blood pool in contrast to other diseases such as myocardial infarction.
Late gadolinium enhancement (LGE)
Graphic representation of LGE patterns are shown.
Considerable number of CA patients shows various LGE on CMR; 70-100%.
Because CA is a systemic disease,
the LGE is observed in the global myocardium.
On the other hand,
due to the strange kinetic of the gadolinium agent described above,
some CA cases don’t have a myocardial abnormality,
but have low signal intensity blood pools.
This is an indirect indication,
and a useful finding for the diagnosis of CA.
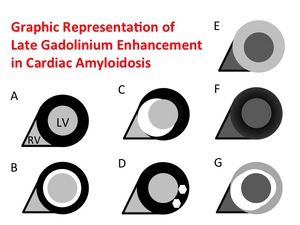
Fig. 11: A. No LGE
B. Global subendocardial LGE
C. Transmural LGE
D. Pathy LGE
E. Global transmural LGE; the contrast (bright myocardium and dark lumen) is inverted with A
F. Suboptimal myocardial nulling with black blood pool; the blood pool is darker than usual, and the image has poor signal-to-noise ratio with a grainy appearance.
G. Combination of various patterns described above; e.c. B+C+E
A.
No LGE (3%)
B.
Global subendocardial LGE (60%)
C.
Transmural LGE (NA)
D.
Pathy LGE (6%)
E.
Global transmural LGE (23%); the contrast (bright myocardium and dark lumen) is inverted with A
F.
Suboptimal myocardial nulling with black blood pool (8%); the blood pool is darker than usual,
and the image has poor signal-to-noise ratio with a grainy appearance.
G.
Combination of various patterns described above (NA); e.c.
B+C+E
The percentages in parentheses were reported from 35 histologic-proven CA cases (3).
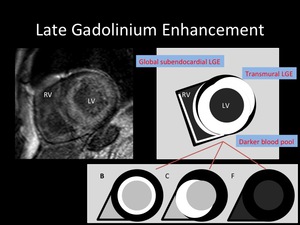
Fig. 12: Representative LGE image of 67-year-old female diagnosed with CA.
This enhancement is a combination of global subendocardial enhancement, transmural enhancement and black blood pool.
Clinical impact of CMR for the diagnosis of CA
The diagnosis of CA has been depending on clinical symptoms,
laboratory data,
and echo.
Furthermore,
the definitive diagnosis has been made by endomyocardial biopsy (Fig.13).
However,
existing diagnostic steps will be changed by CMR,
which has the potential to eliminate cardiac echos and invasive biopsies (Fig.14).
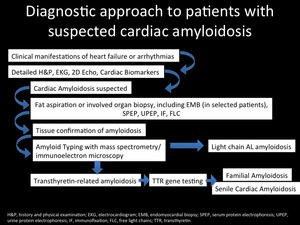
Fig. 13
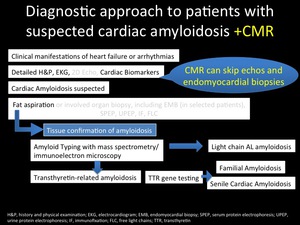
Fig. 14

 of the myocardial nulling is faster than that of the blood pool in contrast to other diseases such as myocardial infarction.")
 is inverted with A
F. Suboptimal myocardial nulling with black blood pool; the blood pool is darker than usual, and the image has poor signal-to-noise ratio with a grainy appearance.
G. Combination of various patterns described above; e.c. B+C+E")
