Digital Breast Tomosynthesis
Digital Breast Tomosynthesis (DBT) was first introduced by Niklason et al in 1997 and has since then been discussed in various publications.
It is an imaging technique that provides multiple images of the breast obtained from different angulations of the X-ray tube while the breast remained in constant position and is a technique of interest for screening and diagnostic procedures because it enables 3D reconstruction.
This capability allows cross-sectional visualization of breast tissue and reduces the difficulty caused by superposition or overlapping of tissue at interpretation of projection mammograms.
In breast imaging,
the potential advantages include but are not limited to the possibility of reducing recall rates in screening mammography,
improving cancer detection in women with dense breast tissue,
improving the diagnosis of benign findings and consequently reducing the number of biopsies with negative findings,
and assessing therapeutic efficacy.
Tomosynthesis acquires multiple 2D images while the X-ray tube moves through a limited angular range over the compressed breast allowing thin slices to be reconstructed by the computer,
from the information obtained (1).
The breast is positioned the same way it is in a conventional mammogram,
but only a little pressure is applied,
just enough to keep the breast in a stable position during the procedure.
Normally the breast would be placed in the MLO or the CC view (6).
While holding the breast stationary,
the x-ray tube is rotated over a limited angular range.
A series of low dose exposures are made every few degrees,
creating a series of digital images.
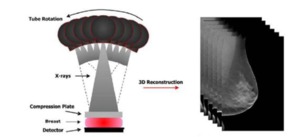
Fig. 1: Illustrative example of digital breast tomosynthesis (right image) acquisition geometry with (left image) the reconstructed tomographic breast image, 3D.
References: Kontos, D. et al (2009): "Parenchymal Texture Analysis in Digital Breast Tomosynthesis for Breast Cancer Risk Estimation: A Preliminary Study"; Academic Radiology; v.16:283:298.
Once the projections of breast are obtained during a tomosynthesis sequency,
they can be reconstructed into a data set of slices through the breast in planes parallel to detector.
Various reconstruction algorithms can then be applied to the set of typically nine to 28 source images to reconstruct 1-mm slices with a reduced risk of obscuring pathology (5).
The reconstructed tomosynthesis slices can be displayed similarly to computed tomography reconstructed slices.
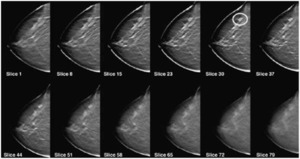
Fig. 2: Reconstructed tomosynthesis slices. An invasive lobular carcinoma can be clearly seen in slice 30.
References: Schulz-Wendtlanda R. et al (2009): "Digital mammography: An update"; European Journal of Radiology; v.72:258-265.
Contrast-enhanced Breast tomosynthesis
Until the development of DBT fusing X-ray imaging of breast with other technology was difficult.
Now with the 3D dataset,
tomosynthesis images can be fused with other imaging studies including contrast-enhancement of breast (5).
Various studies have demonstrated that breast cancers can be detected with contrastenhanced digital mammography and that this technique can increase mammographic lesion conspicuity.
Contrast-enhanced mammography is based on the principle that rapidly growing tumors require increased blood supply to support growth.
The contrast agent preferentially accumulates in such areas,
and contrast-enhanced mammography offers a method of imaging contrast distribution in breast tissue.
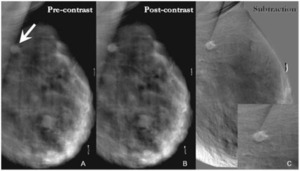
Fig. 3: A - Pre-contrast DBT demonstrates a spiculated mass in the upper right breast projecting over the pectoralis muscle and corresponding to the location of the focal asymmetry on the digital mammogram (arrow). B - This spiculated mass displays avid nonionic contrast enhancement on CE-DBT. C - Subtracted reconstructed CE-DBT image highlights this enhancing, spiculated mass (zoomed image included). Highly suspicious rim enhancement is also seen on this subtraction image.
References: Chen, S. et al (2007): "Initial Clinical Experience With Contrast-Enhanced Digital Breast Tomosynthesis"; Academic Radiology; v.14:229-238.
Sonoelastography
Sonoelastography is a new ultrasound procedure for the reconstruction of tissue elasticity,
an inherent biologic character of tissue,
which could reflect the lesion benign or malignant in some extent.
New techniques of shear wave and strain imaging are key factors in the ongoing improvement of elastography.
Various methods for performing elastography are available on many current ultrasound systems from a variety of manufacturers.
Ultrasound strain elastography which is induced by hand pressure and release allows calculation of tissue elasticity in real time and,
similar to color Doppler,
superimposes the information in color on the Bmode image,
and gets the strain images.
Different color in the strain images represents different elasticity (17).
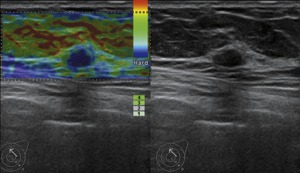
Fig. 4: Invasive ductal carcinoma in a 39-year-old woman. Image of US was on the right side. A hypoechoic mass with regular shape was classified as 3 with BI-RADS. Image of USE was on the left side. The lesion was in blue, scored 4, diagnosed as a malignant lesion. The lesion was classified as 4 with revised BI-RADS.
References: Zhi, H. et al (2012): “Could ultrasonic elastography help the diagnosis of small (≤2 cm) breast cancer with the usage of sonographic BI-RADS classification?”; European Journal of Radiology; v.81; 3216– 3221
Several clinical studies demonstrated that sonoelastography was useful for differentiating between benign and malignant breast lesions with 70.1–100% sensitivity and 41.0–98.5% specificity.
Furthermore,
recent studies have suggested that sonoelastography might be useful for further characterising lesions with a low index of suspicion and thereby reducing the need for biopsies with benign results (16).
Automated Breast Ultrasound
Automated Breast Ultrasound is a high end ultrasound scanner that employs frequencies of 5 to 14 MHz and consists of a flexible arm with the transducer at the end,
a touchscreen and a 3D workstation.
Automatically acquires 15.4 cm × 16.8 cm × 6 cm volume data sets of breasts after one sweep with a wide-aperture linear array transducer (5–14 MHz bandwidth).
The scan is performed with the patient in a supine position (14).
Nowadays ABUS systems can automatically scan the entire breast in a standard manner with optimized settings (imaging presets) for volume acquisition based on the estimated size of the breast (A is smallest size; D+ is largest size),
the system applies imaging parameters during acquisition based on the estimated size of the breast and automatically send all the images to an ABVS workstation.
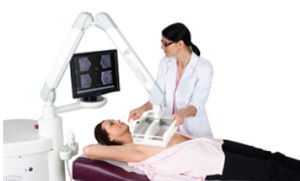
Fig. 5: Automated Breast Ultrasound
References: www.somoinsightstudy.org
Using scrolling slices,
the radiologist can watch the “dynamic play” of all saved images on an ABVS workstation and provide a description and a diagnosis.
This approach minimizes operational variability (7).
A typical examination comprised three automated scans of each breast in the anteroposterior and both oblique positions.
Occasional additional views were required for larger breasts,
the scans being centered on a palpable abnormality or axillary lymph nodes.
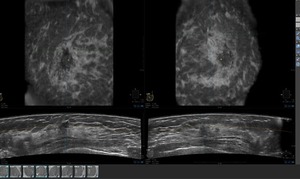
Fig. 6: Left: Retro areolar irregular mass seen in the coronal and transverse views. Right: Spiculated mass seen in the coronal and transverse views.
References: Dean, J. (2012): “Using Automated Breast Ultrasound to Reduce or Eliminate Interval Cancers” in www.diagnosticimaging.com
The aims of automating breast ultrasound are: Decrease the radiologist’s time per case and produce a standardized,
high quality examination that improves the conspicuity of cancers.
This will result in an increased positive predictive value,
especially for 1 cm cancers.
Studies suggested that these goals are possible because their data demonstrated a substantial reduction in radiologist time,
with greater sensitivity and fewer false-positive (7).
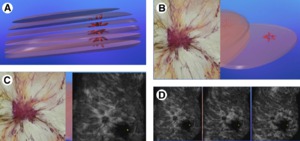
Fig. 7: (A) Schematic presentation of a 10-mm invasive breast cancer, which is present in at least 4 of the 2-mm thick slices. (B) Large section, 2-mm thick subgross 3-D (10 8 cm) histology image shows the spiculated invasive carcinoma. (C) Comparative 3-D histologic 3-D coronal ultrasound section. (D) The series of 2 mm coronal 3-D ultrasound images demonstrates the entire radiating structure. The lesion is seen on several slices, making perception easier. The slices are akin to a stack of cards laid out on the screen side by side.
References: Lander M., Tabár, L. (2011): “Automated 3-D Breast Ultrasound as a Promising Adjunctive Screening Tool for Examining Dense Breast Tissue”; Seminars in Roentgenology; Elsevier.
Breast magnetic resonance imaging
MRI has been successfully implemented in many medical communities as a valuable tool to diagnose additional cancer in the same breast in up to one third of patients and is recommended as a supplemental screening tool to mammography in women considered to be at high risk for developing breast cancer.
A clear advantage of MRI is that it does not use radioactivity and detects blood flow to lesions.
Also,
MRI is more sensitive and accurate than mammography and ultrasound in detection of invasive lobular cancer,
which occurs at a higher rate in women with a history of hormone replacement therapy (12).
Dynamic contrast-enhanced magnetic resonance imaging mammography is a valuable complementary modality to conventional diagnostic method.
In the last years,
nevertheless,
despite its high sensitivity,
breast MRI has played a limited role,
mostly restricted to evaluation of high risk young women,
follow-up of patients after radiotherapy (10).
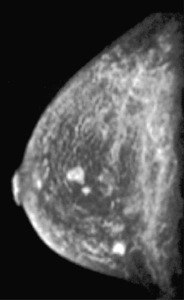
Fig. 8: Invasive ductal carcinoma in a 49-year-old woman. Not-palpable. (a) MIP of sagittal subtracted contrast-enhancedMR 3DFLASH T1 gradient-echo images shows three not-palpable 0.3–0.5 mm-irregular rim-enhancing formations, not demonstrated in previous imaging different modalities
References: Potente, G. et al (2009): “Practical application of contrast-enhanced magnetic resonance mammography [CE-MRM] by an algorithm combining morphological and enhancement patterns”; Computerized Medical Imaging and Graphics 33; 83–90.
MRI advantages include a very high true positive rate,
with demonstration of almost all invasive cancers above 3 mm in diameter.
MRE is an experimental but developing technology,
which,
similar to ultrasound elastography,
obtains information about tissue stiffness for lesion characterization.
Breast-specific gamma imaging
Molecular breast imaging,
or BSGI,
uses a high-resolution,
small–field of view gamma camera specific to breast imaging,
which has demonstrated improved sensitivity for the detection of breast cancer.
The sensitivity of BSGI ranges from 78.6% to 100% for detecting breast cancer,
which is comparable to that of MRI (73%–100%).
Additionally,
both breast MRI and BSGI can detect breast cancers that are mammographically and clinically occult (2).
Breast-specific gamma imaging are usually conducted using 555–925 MBq of 99mTc-sestamibi and a gamma camera. Imaging began 3–10 minutes afterinjection with a minimum of two views of each breast,
including craniocaudal and medial lateral oblique (15).
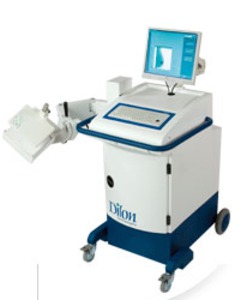
Fig. 9: Breast-specific gamma imaging
References: www.dilon.com
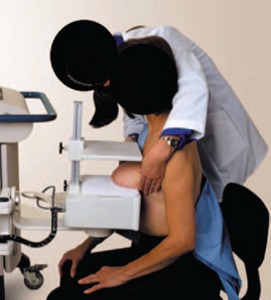
Fig. 10: Patient being positioned for breast-specific gamma imaging
References: Weigert et al (2012): “Results of a Multicenter Patient Registry to Determine the Clinical Impact of Breast-Specific Gamma Imaging, a Molecular Breast Imaging Technique”; AJR:198.
The study performed by Brem et al (2010) concluded that BSGI detected additional suspicious lesions occult to mammography and physical exam in 29% of women with one suspicious or cancerous lesion detected on mammography and/or physical exam.
Breast biopsy or surgery demonstrated occult cancer in 35% of women who underwent biopsy because of findings on BSGI,
which constituted 9% of all women in this study.
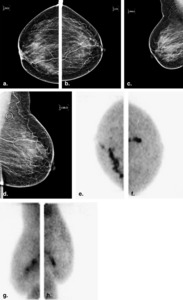
Fig. 11: Breast-specific gamma imaging (BSGI) in a 69-year-old woman who presented with new left breast nipple discharge. (a) Right and (b) Left Cranio-caudal and (c) Right and (d) Left Medio-lateral Oblique mammograms demonstrate scattered heterogenous fibroglandular tissue with vascular calcifications and no other findings. Ultrasound was normal (e) Right and (f) Left Cranio-caudal and (g) Right and (h) Left Medio-lateral oblique BSGI demonstrates linear clumped radiotracer uptake bilaterally, greater on the right than the left. Second look ultrasound demonstrated a vague area of prominent ducts, which on biopsy demonstrated bilateral DCIS.
References: Brem, R. et al (2010): “Detection of Occult Foci of Breast Cancer Using Breast-Specific Gamma Imaging in Women with One Mammographic or Clinically Suspicious Breast Lesion”; Acad Radiol; 17:735–743
Clinical Indications for Molecular Breast Imaging (MBI)
According to the Society of Nuclear Medicine Practice Guidelines for Breast Scintigraphy with Breast-Specific Gamma Cameras,
the clinical indications for imaging with BSGI/MBI include:
- Diagnostic evaluation of indeterminate mammograms or high-risk patients
- Technically difficult imaging including radiodense breast tissue and implants
- Pre-surgical work-up for evaluating extent of disease
- Monitoring Neoadjuvant chemotherapeutic response
- As an alternative to breast MRI for patients for whom MRI is indicated,
but not possible
Positron Emission Mammography
High-resolution Positron Emission Mammography (PEM) is a new technology that is designed for the imaging of specific small body parts where high resolution detection of FDG uptake is needed.
An available dual-detector system consists of 2 flat,
high resolution detector heads mounted directly to compression paddles that can be rotated to optimize imaging,
such as in acquiring mediolateral oblique and craniocaudal breast views.
By lightly compressing the breast tissue during acquisition,
the image can be acquired in positions that are analogous to those used in mammography,
which allows for image coregistration and comparison (11).
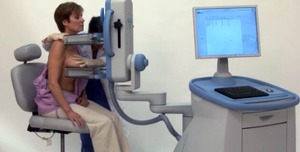
Fig. 12: PEM positioning craniocaudal breast view
References: www.naviscan.com/positioning_cc/
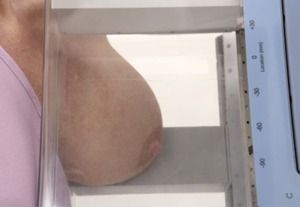
Fig. 13: Positioning of subjects in the PEM scanner for image acquisition in MLO position
References: www.naviscan.com/positioning_cc/
The close proximity of the 13-mm crystal detectors and limited angletomographic reconstruction results in an in-plane spatial resolution of 1.5 mm full width at half maximum.
A recently study concluded that the sensitivity of PEM was compared with WBPET imaging on the same radiotracer dose administered to the same patients.
Substudy analysis compared the sensitivity of PEM versus MRI with regards to menopausal status,
breast density,
and HRT use (12).
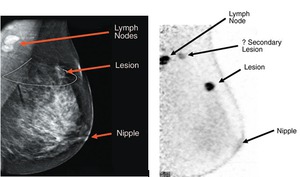
Fig. 14: A comparison of a (A) mammogram and (B) a positron emission mammographic image. The PEM scan shows a secondary lesion that was not appreciated on the mammogram.
References: Shilling et al (2008): “The role of positron emission mammography in breast cancer imaging and management”; www.appliedradiology.com


: “Using Automated Breast Ultrasound to Reduce or Eliminate Interval Cancers” in www.diagnosticimaging.com")
 Schematic presentation of a 10-mm invasive breast cancer, which is present in at least 4 of the 2-mm thick slices. (B) Large section, 2-mm thick subgross 3-D (10 8 cm) histology image shows the spiculated invasive carcinoma. (C) Comparative 3-D histologic 3-D coronal ultrasound section. (D) The series of 2 mm coronal 3-D ultrasound images demonstrates the entire radiating structure. The lesion is seen on several slices, making perception easier. The slices are akin to a stack of cards laid out on the screen side by side. References: Lander M., Tabár, L. (2011): “Automated 3-D Breast Ultrasound as a Promising Adjunctive Screening Tool for Examining Dense Breast Tissue”; Seminars in Roentgenology; Elsevier.")
. B - This spiculated mass displays avid nonionic contrast enhancement on CE-DBT. C - Subtracted reconstructed CE-DBT image highlights this enhancing, spiculated mass (zoomed image included). Highly suspicious rim enhancement is also seen on this subtraction image. References: Chen, S. et al (2007): "Initial Clinical Experience With Contrast-Enhanced Digital Breast Tomosynthesis"; Academic Radiology; v.14:229-238.")
: "Digital mammography: An update"; European Journal of Radiology; v.72:258-265.")
 acquisition geometry with (left image) the reconstructed tomographic breast image, 3D. References: Kontos, D. et al (2009): "Parenchymal Texture Analysis in Digital Breast Tomosynthesis for Breast Cancer Risk Estimation: A Preliminary Study"; Academic Radiology; v.16:283:298.")
: “Could ultrasonic elastography help the diagnosis of small (≤2 cm) breast cancer with the usage of sonographic BI-RADS classification?”; European Journal of Radiology; v.81; 3216– 3221")
 MIP of sagittal subtracted contrast-enhancedMR 3DFLASH T1 gradient-echo images shows three not-palpable 0.3–0.5 mm-irregular rim-enhancing formations, not demonstrated in previous imaging different modalities References: Potente, G. et al (2009): “Practical application of contrast-enhanced magnetic resonance mammography [CE-MRM] by an algorithm combining morphological and enhancement patterns”; Computerized Medical Imaging and Graphics 33; 83–90.")

: “Results of a Multicenter Patient Registry to Determine the Clinical Impact of Breast-Specific Gamma Imaging, a Molecular Breast Imaging Technique”; AJR:198.")
 in a 69-year-old woman who presented with new left breast nipple discharge. (a) Right and (b) Left Cranio-caudal and (c) Right and (d) Left Medio-lateral Oblique mammograms demonstrate scattered heterogenous fibroglandular tissue with vascular calcifications and no other findings. Ultrasound was normal (e) Right and (f) Left Cranio-caudal and (g) Right and (h) Left Medio-lateral oblique BSGI demonstrates linear clumped radiotracer uptake bilaterally, greater on the right than the left. Second look ultrasound demonstrated a vague area of prominent ducts, which on biopsy demonstrated bilateral DCIS. References: Brem, R. et al (2010): “Detection of Occult Foci of Breast Cancer Using Breast-Specific Gamma Imaging in Women with One Mammographic or Clinically Suspicious Breast Lesion”; Acad Radiol; 17:735–743")


 mammogram and (B) a positron emission mammographic image. The PEM scan shows a secondary lesion that was not appreciated on the mammogram. References: Shilling et al (2008): “The role of positron emission mammography in breast cancer imaging and management”; www.appliedradiology.com")