ECR 2013 / C-1784
A vision for global multimedia structured reporting
Congress:
ECR 2013
Poster Number:
C-1784
Type:
Scientific Exhibit
Keywords:
Computer applications, eHealth, Professional issues, RIS, PACS, Teleradiology, Structured reporting, Computer Applications-General, Health policy and practice
Authors:
D. J. Vining1, U. I. S. E. N. Salem1, C. DURAN1, L. Jiang2, A. Pitici3, I. Aghenitei3, C. Popovici3, M. Jurca3, R. Rosu3; 1Houston, TX/US, 2Beijing/CN, 3Chapel Hill, NC/US
DOI:
10.1594/ecr2013/C-1784

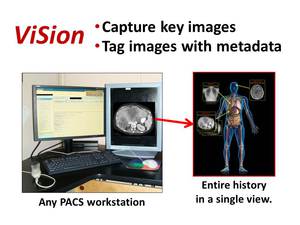
Fig. 2:
The ViSion system works by capturing key images from any PACS or advanced...
.")
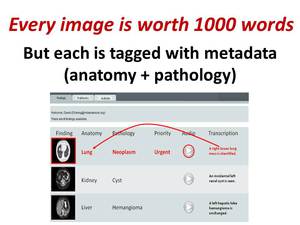
Fig. 3:
A picture is worth 1000 words in whatever language is spoken, but ViSion tags...

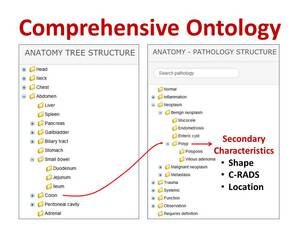
Fig. 4:
An observation or diagnosis in the ViSion system is created by the pairing of...

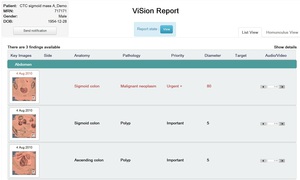
Fig. 5:
This is an example of a ViSion report generated in English. In addition to the...

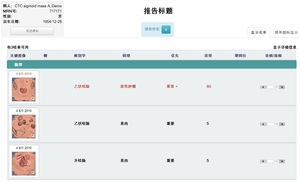
Fig. 6:
Translation of the ViSion report in Figure 5 to Chinese.

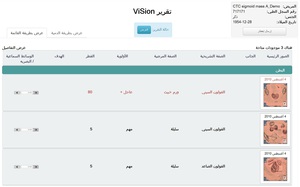
Fig. 7:
Translation of the ViSion report in Figure 5 to Arabic.

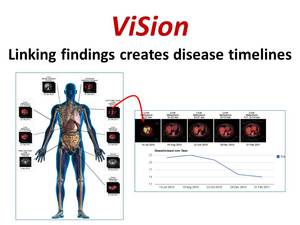
Fig. 8:
ViSion provides the ability to link image findings from serial examinations in...

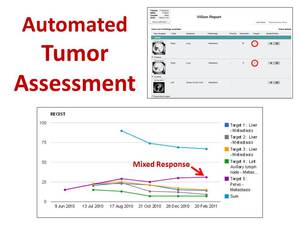
Fig. 9:
Specific image findings in a ViSion report can be designated as "target...

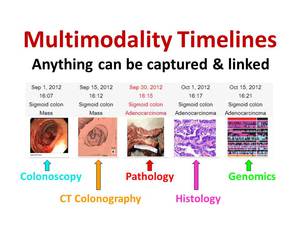
Fig. 10:
The linking of image findings is not limited to radiological images but can be...

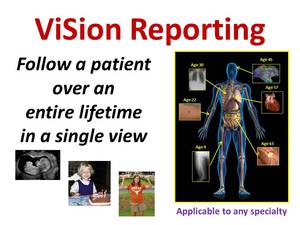
Fig. 11:
ViSion's "composite" view shows the entire history of a patient in a single...