OBSERVATIONS AND RESULTS:
STATISTICAL ANALYSIS OF DATA
Statistical analysis was performed separately in each group.
Each group was compared with control group.
The precision of instrument -:
The square of mean deviation (DEVSQ) was used as measure of precision of instrument.
The mean error in measurement of ONSD was found to be 0.18 and 0.15 mm for left and right optic nerve respectively (i.e. the mean error in measurement of ONSD was 0.17mm).
Thus using a 10 MHz probe and taking 4 reading per optic nerve resulted in high degree of accuracy in measurement of ONSD.
(Table 2)
|
RIGHT ON
|
LEFT ON
|
Mean error
|
|
MEAN DEVSQ=0.15
|
MEAN DEVSQ=0.1824
|
0.17
|
Table 2: Precision of instrument.
N.B: DEVSQ was used as a marker of precision of instrument.
The inter observer variation:
No significant inter observer variation was noticed in sonological measurement optic nerve diameter (P value 0.98).
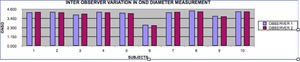
Fig. 4: Bar Charts showing inter obser variation in OND measurement.
No significant inter observer variation was noticed in sonological measurement of optic nerve diameter (P value 0.98)
References: Department of Diagnostic Radiology, King George Medical College, Lucknow, U.P, India.
Male-female variation:
No significant difference existed between the mean ONSD of males and females ( P value 0.75 ).
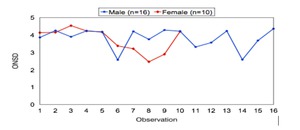
Fig. 5: Male-Female variation.
No significant difference existed between the mean ONSD of males and females ( P value 0.75 ).
References: Department of Diagnostic Radiology, King George Medical College, Lucknow, U.P, India.
MONSD Of Various Groups.
MONSD + 2 SD for age matched controls was 4.99 mm.
Therefore any reading of ONSD > 4.99 mm was considered to be in pathological range.
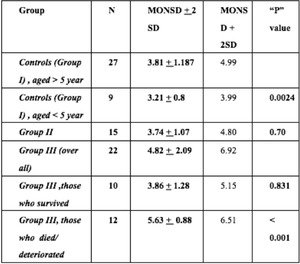
Table 3: MONSD Of various groups
References: DEPartment of Diagnostic Radiology, King George Medical College, Lucknow, U.P, India.
From the above data it is clear that MONSD of hepatic Encephalopathy patients who did not survive/ deteriorated ( MONSD =5.63 mm) was statistically higher then MONSD of age matched controls (MONSD =3.81 mm).The “P” value for this difference was < 0.001,
that is very significant.
On the contrary the MONSD of hepatic Encephalopathy patients who improved/ survived ( MONSD = 3.86 mm) was not statically higher then MONSD of age matched controls.
The “ p” value for this difference was 0.83
The MONSD of Chronic liver disease patients who were not in encephalopathy (i.e.
group II) (MONSD = 3.71mm) was significantly less then MONSD of hepatic encephalopathy patients with poor prognosis (‘p: value < 0.001,
i.e..
is very significant).
Also MONSD of these patients (group II) was not significantly different from the MONSD of age matched controls (“p” value= 0.07).
MONSD Of The Group IV:
The Group IV patients were the patients with stroke (proven by CT scan)/ encephalopathy due to cause other them hepatic encephalopathy.
The MONSD of this heerogenous group is shown below-:
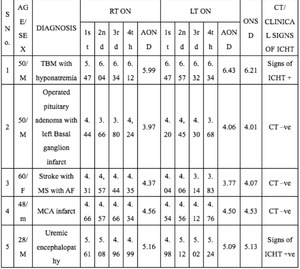
Table 4: Mena Optic Nerve Sheath Daimter (MONSD) of Groups IV patient.
References: Department of Diagnostic Radiology, King George Medical College, Lucknow, U.P, India.
The relationship of MONSD with grade of hepatic encephalopathy:
Out of 13 patients,
with ONSD in pathological range (i.e. ONSD >4.99 mm),
92.31% (n=12) were in either grade 3 (n=7) or Grade 4 (n=5) hepatic encephalopathy.
Only 7.69% were in Grade 2 (n=1) or Grade 1 (n=0) hepatic encephalopathy (See figure 6).
The percentage of patients with dilated ONSD in Grade 1,
Grade 2,
Grade 3 and Grade 4 hepatic encephalopathy was 0%,
12.5%,
100% and 100% respectively (See Fugure 7).
As mentioned above,
in patients with dilated ONSD,
92.31% had Grade 3 or Grade 4 hepatic encephalopathy,
while in patients with non-dilated ONSD 0% were in Grade 3 or Grade 4 hepatic encephalopathy.
The difference in the two groups was statistically significant (p value by chi-square test was <0.001,
See Table below).
Thus a significantly higher proportion of patients with dilated ONSD have Grade 3/Grade 4 hepatic encephalopathy
FIGURE 6
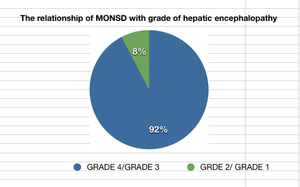
Fig. 6: RELATIONSHIP OF DILATED MONSD AND GRADE OF HEPATIC ENCEPHELOPATHY. (SEE LEGEND)
References: DEPartment of Diagnostic Radiology, King George Medical College, Lucknow, U.P, India.
Figure 7
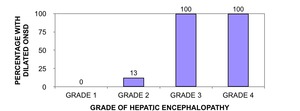
Fig. 7: BAR CHART SHOWING RELATIONSHIP OF DILATED ONSD WITH GRADE OF HEPATIC ENCEPHELOPATHY (HE).
References: Department of Diagnostic Radiology, King George Medical College, Lucknow, U.P, India.
Table showing grade of hepatic encephalopathy (HE) & ONSD: Computation of P value using Chi sqaure test:
|
|
GRADE 1/
GRADE 2 HE
|
GRADE 3/
GRADE 4 HE
|
Total
|
|
|
< 4.99mm
|
Count
|
100 %
|
0%
|
9
|
|
ONSD
|
|
Expected Count
|
4.09
|
4.91
|
9
|
|
|
>4.99mm
|
Count
|
7.69%
|
92.3%
|
13
|
|
|
|
Expected Count
|
5.91
|
7.09
|
13
|
|
Total
|
|
Count
|
10
|
12
|
22
|
|
Chi-square test (p value) =
|
<0.001 i.e. Significant
|
|
Table showing Relationship of ONSD of Group III with Grade of HE :
|
Grade of HE
|
% WITH DILATED ONSD (N = 13)
|
% WITH non DILATED ONSD (N= 10)
|
% OF GROUP 3 PATIENTS
|
|
Grade1
|
0% (N= 0)
|
100% ( N= 2)
|
9.09%
|
|
Grade 2
|
12.5% ( N= 1)
|
87.5% ( N= 7)
|
36.36%
|
|
Grade 3
|
100% ( N=7)
|
0% (N=0)
|
31.82%
|
|
Grade 4
|
100% (N= 5)
|
0%( N= 0)
|
22.73%
|
Prognostic Implication of Dilated ONSD:
Out of all the patients with ONSD in pathological range,
92.3% deteriorated while only 7.69% patients improved.
In contrast to this,
among the hepatic encephalopathy patients with ONSD within normal range none deteriorated (i.e. all the patients improved.)
FIGURE 8: Bar chart showing relationship of observed ONSD and prognosis of HE patient.
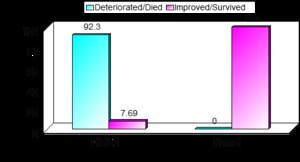
Fig. 8: BAR CHART SHOWING RELATIONSHIP OF OBSERVED ONSD AND PROGNOSIS OF HEPATIC ENCEPHELOPATHY PATIENTS.
References: Department of Diagnostic Radiology, King George Medical College, Lucknow, U.P, India.
Positive Predictive value of dilated ONSD in detecting the patients with poor outcome:
The positive predictive value of ONSD >4.99 mm in predicting poor outcome was thus 92.3% (See table below).
Also,
taking ONSD >4.99 mm as pathological,
resulted in 100% sensitivity in detection of hepatic encephalopathy patients with poor outcome.
The specificity of ONSD> 4.99 mm in detection of hepatic encephalopathy patients with poor outcome was 90%.
Only 10% patients were falsely predicted as “poor outcome”,
while no patient was falsely predicted as “good outcome”.
The association of raised ONSD with higher grade of hepatic encephalopathy was consistently observed in present study
|
Criterion Used
|
Outcome
|
|
Not improve
|
Survived
|
Total
|
|
ONSD >4.99 mm
|
12
|
1
|
13
|
|
ONSD <4.99
|
0
|
9
|
9
|
|
Sensitivity
|
Specificity
|
Positive Predictive value for poor prognosis
|
% Falsely predicted as poor outcome
|
|
100%
|
90%
|
92.31
|
10%
|
Proposed Classification of Hepatic encephalopathy patients based ONSD:
The association of raised ONSD with higher grade of hepatic encephalopathy was consistently observed in present study.
Classification of hepatic encephalopathy is based on clinical grounds.
Tradionally,
Hepatic encephalopathy patients have been classified into 4 grades:
- Mild confusion,
euphoria,
anxiety,
depression,
shortened attention span,
slowing of ability to perform mental test and reversal of sleep rhythm (grade I)
- Drowsiness,
lethargy,
gross deficits in ability to perform mental tasks,
obvious personality changes,
inappropriate behaviour,
intermittent disorientation of time and place and lack of sphincter control (grade II)
- Somnolent but arousable,
persistent disorientation of time and place,
pronounced confusion and inability to perform mental tests (grade III)
- Coma with (IVa) or without (IVb) response to painful stimuli.
In the present study 100% of Grade III patients showed dilated ONSD.
All the patients with Grade IV hepatic encephalopathy also showed ONSD in dilated range.
Only apporx.
13% of the patients with Grade II hepatic encephalopathy showed dilated ONSD.
Finally,
none of the patient in Grade I hepatic encephalopathy,
showed ONSD in dilated range.
(see Figure 7 above)
Also,
92.3% of patients with dilated ONSD either died/deteriorated and only 7.7% of hepatic encephalopathy patients with dilated ONSD survived/improved (see figure 8 above).
The MONSD–2SD (left tail of ONSD distribution curve) in non-survivors/deteriorated group of hepatic encephalopathy patients was 4.75 mm.
While,
MONSD +2 SD (Right tail of ONSD distribution curve) in survivor/ improved group of hepatic encephalopathy patient was 5.15 mm (See Figure 9).
Figure 9: Gaussian curve
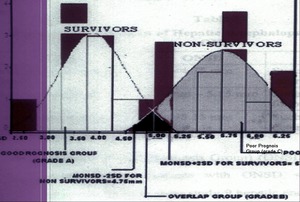
Fig. 9: GAUSSIAN DISTRIBUTION OF OPTIC NERVE DIAMETER ANALYSED- A PROPOSED CLASSIFICATION OF HEPATIC ENCEPHELOPATHY
References: Department of Diagnostic radiology, King George Medical College, Lucknow, U.P, India.
Based on this analyses based on optic nerve sheath diamter,
we propose following classifcation of the hepatic encephalopahty patinets -:
PROPOSED CLASSIFCATION OF HEAPTIC ENCEPHALOPATHY BASED ON ONSD:
|
Group
|
ONSD
|
Comment
|
|
Good prognosis group (Grade A)
|
<4.75 mm
|
Such a patient is likely to improve
|
|
The Overlap group (Grade B)
|
4.75 mm – 5.15 mm
|
Such a patient should be followed by serial sonography
|
|
Poor prognosis group (Grade C)
|
>5.15 mm
|
Such a patient is likely to deteriorate
|
Grade A (Good Prognosis Group) (ONSD <4.75 mm):-All hepatic encephalopathy patients with ONSD <4.75 mm are likely to improve.
In the present study 9 hepatic encephalopathy patients were found to have ONSD <4.75 mm.
Out of 9 patients,
7 patients (77.8%) were found to be in Grade II hepatic encephalopathy.
22.2% (n=2) patients were in Grade I hepatic encephalopathy .
All patients with ONSD <4.75 mm survived/improved.
Grade B (The overlap group) (ONSD 4.75-5.15 mm):- In the present study 4 patients were found to have ONSD in the range of 4.75-5.15 mm.
Of the 4 patients,
one patient (i.e. 25%) survived/improved.
Remaining 3 (75%) patients died/deteriorated.
All these 3 patients were in Grade III hepatic encephalopathy.
The one patient who improved,
showed fall in ONSD (final ONSD = 4.12 mm) in follow up scan.
Grade C – Poor Prognosis Group (ONSD >5.15 mm):-9 patients of hepatic encephalopathy were found to have ONSD in this range.
Of the 9 patients,
4 were in grade III hepatic encephalopathy (44.4%) and 5 (55.5%) were in Grade IV hepatic encephalopathy.
All these patients either died or deteriorated.
Correlation Of Old (Clinical) And Proposed Classification Of Hepatic Encephalopathy:
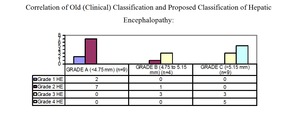
Fig. 10: CORRELATION OF OLD (CLINICAL) CLASSIFICATION OF HEPATIC ENCEPHELOPATHY AND PROPOSED CLASSIFICATION OF HEPATIC ENCEPHELOPATHY
References: Department of Diagnostic Radiology, King George Medical College, Lucknow, U.P, India.
Thus,
by classifying hepatic encephalopathy patients on the basis of their Optic nerve sheath diamter,
one can predict outcome of these patients.
Also,
such a classification will be helpful in triaging and management of hepatic encephalopathy patients.

. Thus using a 10 MHz probe and taking 4 reading per optic nerve resulted in high degree of accuracy in measurement of ONSD. References: Department of Diagnostic Radiology, King George Medical College, Lucknow, U.P, India.")
 References: Department of Diagnostic Radiology, King George Medical College, Lucknow, U.P, India.")
. References: Department of Diagnostic Radiology, King George Medical College, Lucknow, U.P, India.")

 of Groups IV patient. References: Department of Diagnostic Radiology, King George Medical College, Lucknow, U.P, India.")
 References: DEPartment of Diagnostic Radiology, King George Medical College, Lucknow, U.P, India.")
. References: Department of Diagnostic Radiology, King George Medical College, Lucknow, U.P, India.")


 CLASSIFICATION OF HEPATIC ENCEPHELOPATHY AND PROPOSED CLASSIFICATION OF HEPATIC ENCEPHELOPATHY References: Department of Diagnostic Radiology, King George Medical College, Lucknow, U.P, India.")