CYTOLOGY:
Out of the 130 nodules 117(90%) were proved by cytology to be benign and 13(10%) were malignant.
The Cytological distribution of nodules is shown in figure 5( Fig. 4 ) .
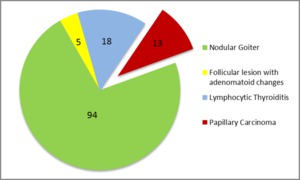
Fig. 4: Cytological distribution of nodules
ULTRASOUND:
Based on conventional ultrasound findings all the 130 nodules were categorize as per TIRADS criteria ( Fig. 5 ).
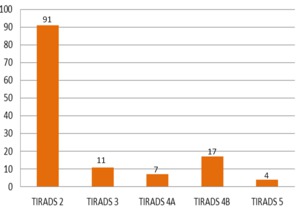
Fig. 5: Distribution of nodules under TIRADS category
For statistical analysis,
nodules under category 2 and category 3 were considered as benign and the nodules under category 4 and category 5 were considered as malignant.
VTQ ANALYSIS:
The mean VTQ value (shear wave velocity) for benign nodules was 2.01±1.46 m/sec and for malignant nodules was 7.21±1.63 m/sec.
The difference in VTQ values for benign and malignant nodules was statistically significant with P value < 0.05.
The best cut off value to differentiate benign and malignant nodules was determined as 3.55 m/s.
This cut off value was obtained when the Youden index was maximal (0.923).
( Fig. 6 )
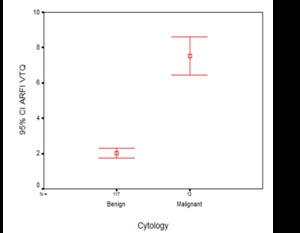
Fig. 6: Error bar displaying VTQ value distribution in benign and malignant nodules.
VTI ANALYSIS:
For statistical analysis,
nodules,
which were soft and with equal stiffness were considered as benign and the hard nodules were considered as malignant.
Distribution of various nodules by VTI (Fig. 7).
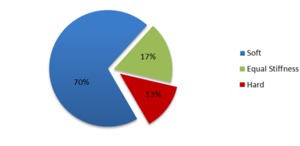
Fig. 7: Distribution of thyroid nodule under VTI
Out of 117 benign nodules,
90 nodules (76.9%) were soft,
22 nodules (18.8%) showed equal stiffness and 5 (4.2%) of them were hard in VTI images.
Whereas,12 out of 13 malignant nodules (92.3%) appeared as hard in VTI images.
Comparison of ROC curves of conventional sonography,
VTQ and VTI methods:( Fig. 8 )
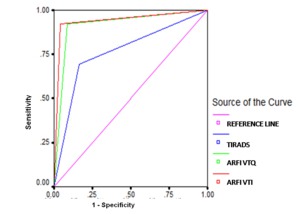
Fig. 8: Comparison of ROC curves of conventional sonography, VTQ and VTI methods.The sensitivity, specificity and diagnostic accuracy of ARFI method for malignant nodules are higher than TIRADS (based on B-mode and colour doppler ). The area under ROC curve is maximum for VTI method with marginally higher sensitivity than VTQ.
