ECR 2015 / C-0725
Role of Diffusion Weighted MRI in differentiating benign and malignant focal liver lesions
This poster is published under an open license. Please read the disclaimer for further details.
Congress:
ECR 2015
Poster Number:
C-0725
Type:
Scientific Exhibit
Keywords:
Abdomen, Liver, Oncology, MR, MR-Diffusion/Perfusion, Percutaneous, Comparative studies, Efficacy studies, Statistics, Cancer, Metastases, Haemangioma
Authors:
R. Sudhir; Hyderabad/IN
DOI:
10.1594/ecr2015/C-0725

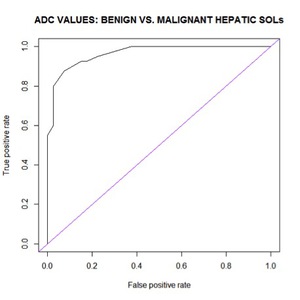
Fig. 1:
ROC curve to determine the cut off point of ADC to discriminate malignant and...

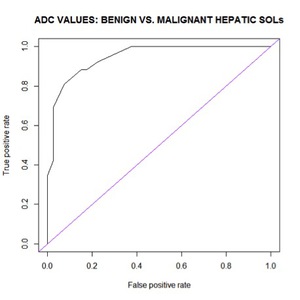
Fig. 2:
ROC curve to determine cut off point of ADC value to distinguish malignant and...
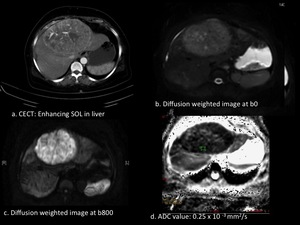
 CECT arterial phase showed an enhancing mass in the liver with neovascularity and central necrosis. (b & c.) DWI at b0 and b800 revealed increase in signal intensity on increasing b value. (d.) Very low ADC value References: basvatharkam Indo-American Cancer Hospital, Hyd/In.")
Fig. 3:
60 year male with Hepato-cellular carcinoma: (a.) CECT arterial phase showed an...
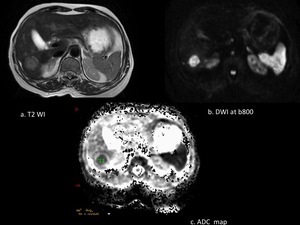
 Well defined hyperintense SOL on T2WI in right lobe of liver. (b.) Restriction on DWI.(c.) low ADC value. References: Basvatharkam Indo-American Cancer Hospital, Hyd/In.")
Fig. 4:
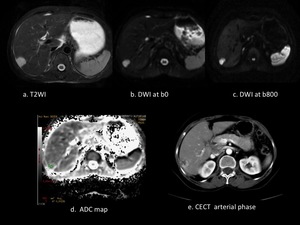
62year female with hepatic metastasis from carcinoma cervix: (a.) Well defined...
 Intensely hyperintense lesion on T2WI. (b &c.) persistence of hyperintense signal on increasing b value. (d.) High ADC value compared to surrounding liver parenchyma. (e.) Peripheral nodular enhancement in arterial phase of CECT, typical of hemangioma. References: Basvatharkam Indo-American Cancer Hospital, Hyd/In.")
Fig. 5:
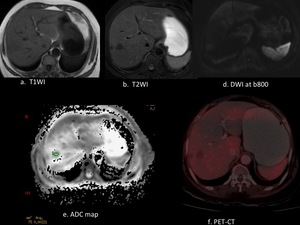
55 year old female with liver hemangioma in known c/o carcinoma ovary: (a.)...
 Mildly hypointentse on T1WI compared to normal liver parenchyma. (b.) Hypointense on T2WI. (c.) Mild restriction on DWI. (d.) ADC value of 2.2 x 10⁻³ mm2/sec. (e.) Metabolically inactive on PET-CT. References: Basvatharkam Indo-American Cancer Hospital, Hyd/In.")
Fig. 6:
70 year old male with degenerating nodule in right lobe of liver in a known c/o...