1.
Radiographic assessment of hip dysplasia in the mature adult pelvis
Radiographic technique
Conventional radiography is the initial step in evaluating etiology of hip pain in any patient.
Hip morphology can be entirely assessed with six views: anteroposterior (AP) pelvic view,
cross-table lateral view,
frog-leg lateral view,
a 45º or 90º Dunn view,
and false-profile view; but all of these views are not routinely performed on each patient.
In general,
the AP pelvic and false-profile views provide the most useful information in radiographic assessment of acetabular dysplasia.
The AP view of the pelvis is the single most important view in the evaluation of acetabular dysplasia and is the first radiographic step in the study of adult hip pain.
This view is performed with the patient in supine position and both legs slightly internally rotated (15-20º) to compensate for femoral anteversion.
Appropriate position is guaranteed when the coccyx and symphysis are aligned,
obturator foramina have a symmetric appearance (not rotation),
and the tip of the coccyx is between 1 to 3 cm above the superior border of the pubic symphysis (not tilt).
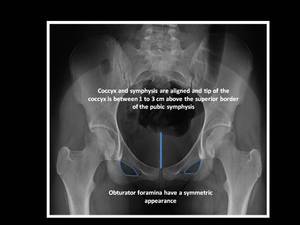
Fig. 1: Anteroposterior pelvic radiograph.
When an acetabular abnormality has been found on the AP view of the pelvis,
a false-profile view of the pelvis is obtained to evaluate anterior coverage of the acetabulum.
The false-profile view is performed with the patient in a standing position with the affected hip on the cassette with ipsilateral foot parallel and pelvis rotated 65º from the cassette plane.
This view is technically adequate when the distance between the two femoral heads is approximately the size of one femoral head.
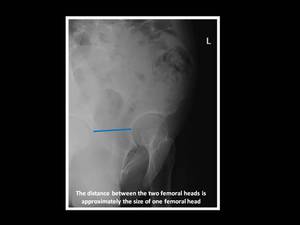
Fig. 2: False-profile pelvic radiograph.
Radiographic measurement in DDH
Radiographic features of adult hip dysplasia,
ranging from subtle acetabular dysplasia to a completely dislocated "high-riding" hip,
are not uncommon in our everyday practice and numerous measurements used for clinical evaluation and surgical planning have been reported.
The most commonly used measurements of DDH are:
The lateral center-edge (CE) angle or angle of Wiberg is obtained from an AP pelvic radiograph and is used to assess the superolateral coverage of the femoral head by the acetabulum.
It is the most important measurement because an abnormal CE angle is diagnostic of acetabular dysplasia.
This angle is formed by the angle between two lines: the first line through the center of the femoral head perpendicular to the horizontal line extending through the center of both femoral heads; and the second line through the center of the femoral head passing through the most superolateral margin of the acetabulum.
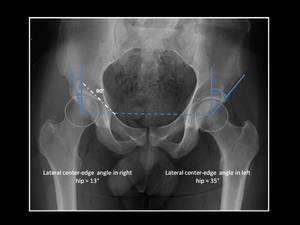
Fig. 3: Technique for measurement of lateral center-edge (CE) angle (or angle of Wiberg).
Anteroposterior pelvic view shows right hip dysplasia (CE angle < 20º).
The diagnosis of hip dysplasia can be made with a lateral CE angle of Wiberg of less than 20º.
A lateral CE angle value greater than 25° is normal.
Values of 20–25° are considered borderline in terms of coverage of the femoral head.
- Anterior center-edge angle (or vertical center-edge angle or angle of Lequesne)
The anterior center-edge angle is measured on a lateral or false-profile radiograph and is used to evaluate anterosuperior acetabular coverage.
This angle is formed between a line connecting the central femoral head and anterior acetabular rim,
and a vertical line through the center of the femoral head.
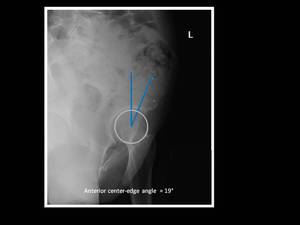
Fig. 4: Technique for measurement of anterior center-edge angle (or vertical center-edge angle or angle of Lequesne).
False-profile pelvic view shows inadequate anterosuperior coverage of the femoral head in left hip (anterior center-edge angle < 20º).
Normal anterosuperior acetabular coverage is present when the anterior center-edge angle is greater than 25°.
An anterior center-edge angle measuring less than 20° is considered diagnostic of hip dysplasia.
Anterior center-edge angle between 20° and 25° are considered borderline.
The Tönnis angle,
also known as the sourcil angle or horizontal toit externe (HTE) angle,
is used to evaluate the inclination of the acetabular roof.
The "acetabular sourcil" is referred to as the sclerotic weightbearing portion of the acetabulum.
This angle is formed between two lines on the AP pelvic view: an horizontal line parallel to the horizontal axis of the pelvis running through the most inferior point of the sclerotic acetabular sourcil; and a tangential line extending from the medial to lateral edges of the sclerotic acetabular sourcil.
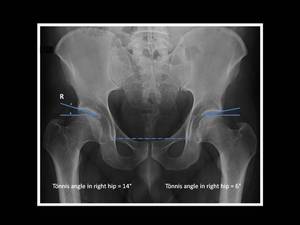
Fig. 5: Technique for measurement of Tönnis angle (or HTE angle or acetabular index).
Anteroposterior pelvic view shows right hip dysplasia with Tönnis angle > 10º.
A Tönnis angle equal to or less than 10° is considered normal,
whereas a measurement greater than 10° is a radiographic sign of hip dysplasia
The Sharps angle gives a global estimation of acetabular inclination.
This angle is obtained from an AP pelvic view and it is formed by connecting a horizontal line from the distal teardrop and oblique line to the superolateral acetabular rim.
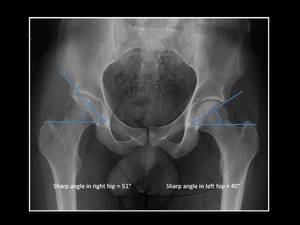
Fig. 6: Technique for measurement of Sharps angle.
Anteroposterior pelvic view in a patient with right hip dysplasia shows Sharps angle > 45º.
A Sharps angle greater than 45º is seen in patients with hip dysplasia.
The acetabular index of depth to width evaluates the depth of the acetabulum.
This measurement is obtained by the ratio of the acetabular width (distance from the lateral edge of the acetabular roof to the most inferior point of the acetabulum) and the acetabular depth (perpendicular distance from the midpoint of the width line to the acetabular dome) on an AP pelvic view.
A ratio depth/width ×1000 is then obtained.
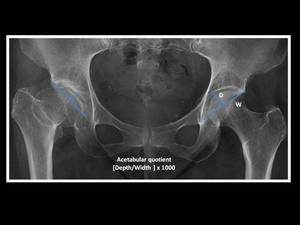
Fig. 7: Technique for measurement of acetabular quotient.
Anteroposterior pelvic view in a patient with right hip dysplasia and acetabular quotient < 250.
Values of this ratio inferior to 250 is seen in hip dysplasia.
Femoral head extrusion index and femoral head coverage are an alternative estimation of acetabular coverage.
These measurements are calculated on an AP pelvic view by three vertical lines: the first line is drawn through the most medial aspect of the femoral head,
the second through the lateral aspect of the acetabulum and the third through the most lateral aspect of the femoral head.
To calculate the femoral head extrusion index,
the distance between the second and third lines (the length of femoral head lying beyond the confines of the acetabulum) is divided by the distance between the first and third (the total horizontal width of femoral head) and finally the result is multiplied by 100 to obtain a percentage.
To calculate the femoral head coverage,
the distance between the first and second lines (the length of femoral head covered by the acetabulum) is divided by the distance between the first and third line (the total horizontal width of femoral head) and finally the result is multiplied by 100 to obtain a percentage.
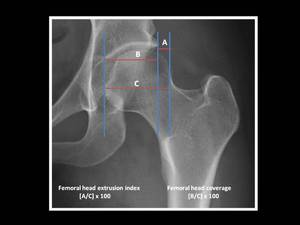
Fig. 8: Technique for measurement of femoral head coverage and femoral head extrusion index on an AP pelvic view magnified to right hip.
A femoral head coverage inferior to 75% or a femoral head extrusion index greater than 25% are seen in patients with hip dysplasia.
A femoral head coverage inferior to 75% or a femoral head extrusion index greater than 25% are pathologic values and are seen in hip dysplasia.
The femoral head-neck-shaft angle,
measured on coronal cross-sectional images or AP pelvic view,
is the angle formed by a line through the femoral neck axis passing though the center of the femoral head,
and a line through the long axis of the femoral shaft with the apex at the intertrochanteric line.
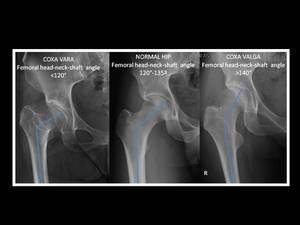
Fig. 9: Measurement of femoral head-neck-shaft angle.
The normal values in adults range from 120º to 140º.
An increased femoral head-neck- shaft angle greater than 140° is diagnostic of coxa valga,
whereas a decreased femoral head-neck- shaft angle of less than 120° is diagnostic of coxa vara.
Although hip dysplasia may be associated with coxa valga,
patients may have a normal or even decreased femoral head-neck- shaft angle.
The importance of the femoral head-neck-shaft angle,
as well as the femoral anteversion angle as we are referred to further on in this presentation, lie on they may affect the surgical decision.
It is to be noted that an excessive external rotation of the femur or femoral anteversion may simulate a coxa valga deformity.
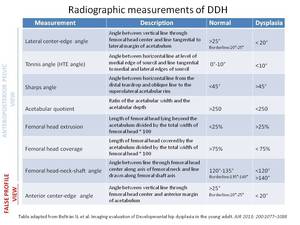
Fig. 21: Radiographic measurements of DDH
2.
Cross-sectional assessment of hip dysplasia in the mature adult pelvis
2.1 Computed Tomography
Although plain films are the gold standard for diagnosis of DDH in young adults,
CT is a valuable complementary technique in the evaluation of the type and degree of acetabular deficiency especially when surgical correction is planned.
Axial CT images assess the type of acetabular deficiency by measurement of anterior acetabular sector angle (AASA),
the posterior acetabular sector angle (PASA),
and the horizontal acetabular sector angle (HASA); as well as the femoral antetorsion.
Coronal CT images can also be used to calculate the lateral center-edge angle,
the anterior center-edge angle,
the Tönnis angle and the femoral neck shaft angle as we have described before but these measurement,
borrowed from radiographic literature,
have been only partially validated for CT.
CT measurement in DDH
Acetabular coverage assessment
The most commonly used measurements on axial TC images in the evaluation of acetabular deficiencies in young patients with hip dysplasia are:
The AASA evaluates for anterior acetabular coverage of the femoral head,
which is the most common deficiency in patients with hip dysplasia.
This angle is measured using a transverse femoral head center slice above the greater trochanter by drawing two lines,
the first line through the center of both femoral heads and the second is an oblique line from the center of the femoral head to the most anterior point of the acetabulum.
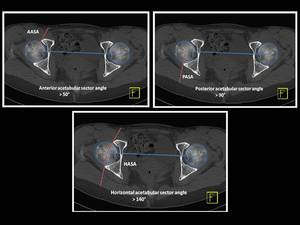
Fig. 10: Technique for measurement of anterior acetabular sector angle (AASA), posterior acetabular sector angle (PASA) and horizontal acetabular sector angle (HASA) on axial CT through the center of femoral heads one cut above the greater trochanter in a patient with normal acetabular coverage.
Adequate anterior acetabular coverage is present when the anterior acetabular sector angle is greater than 50°.
- Posterior acetabular sector angle (PASA) Fig. 10
The PASA assesses for posterior acetabular coverage of the femoral head and TC is the only technique to fully assess this measurement.
This angle is measured using a transverse femoral head center slice above the greater trochanter by drawing two lines,
the first line through the center of both femoral heads and the second is an oblique line from the center of the femoral head to the most posterior point of the acetabulum.
Adequate posterior acetabular coverage is present when the posterior acetabular sector angle is greater than 90°.
The HASA evaluates for global acetabular coverage of the femoral head and is obtained by summing the AASA and PASA angles.
Adequate global acetabular coverage is present when the horizontal acetabular sector angle is greater than 140°.
Fig. 11
Assessment of the Femoral anteversion
The femoral neck-shaft angle and the femoral anteversion angle are the most important measurements of the proximal femur to be considered in patients with hip dysplasia and they are obtained especially when surgical correction is considered.
The femoral anteversion angle refers to the relative rotation between the neck and the shaft of the femur.
It consists on two axial TC images fused,
the first slice through the femoral head and neck to obtain a line through the femoral neck axis,
and the second slice through both femoral condyles to draw the posterior bicondylar tangential line.
The angle between the projected longitudinal axis of the femoral head and neck and the posterior bicondylar tangential line represents the femoral anteversion angle.
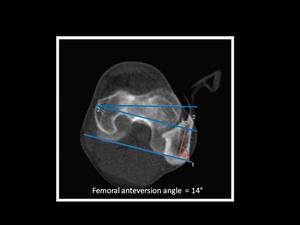
Fig. 12: Technique for measurement of femoral ateversion angle.
Normal values for femoral anteversion angle are 12°–15° for adults although there is significant variability,
so the most widely accepted normal range for femoral anteversion angle is 10 to 20º.
An increased femoral anteversion angle is commonly found in hip dysplasia. Fig. 13
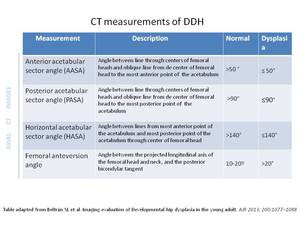
Fig. 22: Table 2. CT measurements of DDH.
In the other hand,
3D volume-rendered reconstructions aids the surgeon in preoperative assessment and planning,
allowing an accurate evaluation of the bony anatomy and more precise quantification of the severity of acetabular dysplasia.
Fig. 14,
Fig. 15
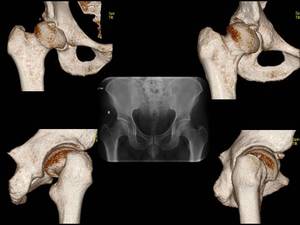
Fig. 15: A 33 year-old man with right hip dysplasia. Anteroposterior pelvic view and 3D CT volumetric reconstruction images demonstrate an aspherical femoral head with deficient lateral and anterior coverage of the femoral head in right hip. Note an osseous fragment detachment from the anterior acetabular rim.
2.2 MRI and MR-arthrography
The major advantage of MRI is the ability to delineate soft-tissue structures as well as osseous structures without ionizing radiation,
providing morphologic information useful in assessing acetabular deficiency.
MRI measurement in DDH
Recently published articles described how to measure the lateral center-edge angle on MRI images accurately when we evaluate a patient with DDH.
The lateral center-edge angle can be measured by MRI using an anterior to middle anteroposterior coronal view where femoral head forms a circle,
employing the same landmarks used in plain X-ray examinations.
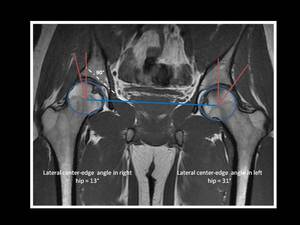
Fig. 16: Technique for measurement of lateral center-edge (CE) angle (or angle of Wiberg) on MRI.
Mid-coronal MRI image in a young patient with mild right hip dysplasia, showing a lateral CE angle < 20º.
An abnormal cranial position of the fovea capitis has been reported in patients with hip dysplasia and it can be quantified with the use of the delta angle on pelvis radiograph AP view as well as on MRI mid-coronal image.
This angle is formed between two lines,
the first line from the center of the femoral head to the medial edge of the acetabular sourcil (sclerotic weightbearing portion of the acetabulum) and the second line also from the center of the femoral head to the superior edge of the fovea capitis.
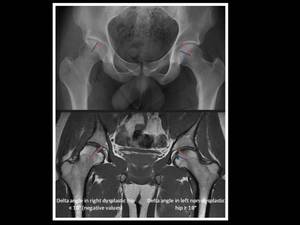
Fig. 17: Technique for measurement of delta angle (fovea capitis position) on AP pelvis radiograph and mid-coronal MRI image in a dysplasic right hip and non-dysplatic left hip, by drawing two lines extending from center of the femoral head to medial edge of sourcil (red line) and superior edge of fovea capitis (blue line).
In this example, the delta angle in right dysplastic hip has negative values secondary an abnormally high position of the fovea capitis.
When the delta angle is ≤ 10º is considered abnormal (fovea alta) and it has been related to hip dysplasia.
MRI findings in DDH
In DDH,
the deficient acetabular coverage of the femoral head leads to instability of the hip with anterolateral migration of the femoral head leading to joint incongruity and/or reduced joint surface area,
with resulting increased stress on the anterior and anterosuperior acetabulum.
It is well-recognized that DDH predispose to premature development of osteoarthritis,
a major complication of delayed treatment of hip dysplasia in adults.
Currently,
the diagnosis of osteoarthritis is based on radiographic findings but MRI has the potential to detect chondral injury and labral damage in dysplastic hips,
early in the degenerative process.
Therefore,
MRI and MR arthrography are particularly useful in the assessment of soft-tissue abnormalities in adult patients with hip dysplasia.
Several typical findings have been reported:
- Labral damage,
including hypertrophy,
intrasubstance signal change,
labral tear or chondrolabral junction detachment,
most frequently located at the anterosuperior quadrant of the acetabulum
The dysplastic acetabular labrum is typically thick and shows mucoid degeneration.
The enlarged acetabular labrum initially aids in maintaining the femoral head within the joint.
If chronic shear stress persists,
the labral soft tissue compensation fails,
tearing the labrum,
sometimes with a bony or cartilage fragment associated secondary to stress fractures of the acetabular rim.
In addition,
patients with hip dysplasia may have a higher incidence of posterior or more diffuse labral tears than those seen in non-dysplastic hips.
- Ganglia and paralabral cyst
In a dysplastic hip,
ganglia formation and paralabral cyst are more frequent,
especially associated with labral pathology; they are typically extraarticular in location and may erode into the adjacent bone.
- Chondral defects along the acetabular articular cartilage
Cartilage loss in patients with acetabular dysplasia is usually identified in an anterior or anterosuperior position,
especially at the chondrolabral transitional zone.
- Ligamentum teres elongation,
hypertrophied,
degeneration and/or tear.
Fig. 18 ,
Fig. 19 ,
Fig. 20
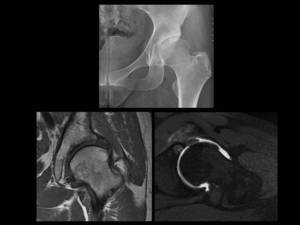
Fig. 18: A 38 year-old woman with left hip dysplasia.
Anteroposterior pelvic view magnified to left hip demonstrate an aspherical femoral head with deficient lateral acetabular coverage and changes of secondary osteoarthritis in left dysplastic hip.
Coronal T1-weighted MRI and axial oblique T1 fat-suppressed MR arthrographic images show and hypertrophic labrum with intrasubstance signal abnormality related to
severe degeneration. Note also degenerative change with full-thickness cartilage defect, marginal osteophyte formation and an anterior acetabular subchondral cyst.


 angle (or angle of Wiberg).
Anteroposterior pelvic view shows right hip dysplasia (CE angle < 20º).")
.
False-profile pelvic view shows inadequate anterosuperior coverage of the femoral head in left hip (anterior center-edge angle < 20º).")
.
Anteroposterior pelvic view shows right hip dysplasia with Tönnis angle > 10º.")


, posterior acetabular sector angle (PASA) and horizontal acetabular sector angle (HASA) on axial CT through the center of femoral heads one cut above the greater trochanter in a patient with normal acetabular coverage.")


 angle (or angle of Wiberg) on MRI.
Mid-coronal MRI image in a young patient with mild right hip dysplasia, showing a lateral CE angle < 20º.")
 on AP pelvis radiograph and mid-coronal MRI image in a dysplasic right hip and non-dysplatic left hip, by drawing two lines extending from center of the femoral head to medial edge of sourcil (red line) and superior edge of fovea capitis (blue line).
In this example, the delta angle in right dysplastic hip has negative values secondary an abnormally high position of the fovea capitis.")


; and axial CT image shows deficient anterior, posterior and global acetabular coverage with decreased AASA, PASA and HASA (AASA = 46º , PASA = 87º ad HASA = 133º).")

