1.“Banana sign” :
- The banana sign is found in cases of defective neural tube,
particularly in Arnold-Chiari II malformation.
In such cases,
the posterior fossa is small,
and the cisterna magna loses its typical configuration.
- There is herniation of the brainstem and cerebellar tonsils through the foramen magnum,
with the cerebellum surrounding the brainstem with a curved shape of a banana.

Fig. 1
References: http://radiopaedia.org/
Ultrasonography image acquired at the second gestational trimester,
at the level of the posterior fossa.
Observe the abnormal appearance of the cerebellum,
surrounding the brainstem,
and taking the curved shape of a banana (the banana sign).
2.“Boxcar ventricle” :
- The boxcar ventricle sign represents the prominent aspect of the lateral ventricles observed in the coronal plane in cases of Huntington’s disease,
secondary to atrophy of the basal nuclei,
particularly the caudate nuclei.
- Huntington’s disease is an autosomal dominant neurodegenerasitive disease,
which affects particularly young adult individuals.
- Huntington’s disease causes muscles discoordination and cognitive and behavioral alterations.
- The finding of ventricular dilatation,
as well as basal ganglia atrophy,
is very sensitive,
but poorly specific.

Fig. 2
References: Radiol Bras. 2011 Mar/Abr;44(2):129-133
Coronal T2-weighted of a 50-year-old male patient with cognitive deficit,
involuntary hands/ fingers movements and muscles discoordination.
Observe bilateral atrophy of caudate nuclei and
compensatory dilatation of lateral ventricles,
a finding known as boxcar ventricle,
observed in Huntington’s disease.
3.Bare orbit sign :
- Refers to the appearance of the orbit on a frontal radiograph of the skull and is so called because of the absence of the innominate line,
which is the projection of the greater wing of the sphenoid bone.
- In addition to the absence of the innominate line,
there is egg-shaped enlargement of the anterior orbital rim,
a bony defect in the posterior orbit,
and anteroposterior enlargement of the middle cranial fossa.
- This sign is seen in sphenoid wing dysplasia in neurofibromatosis type 1 (NF1).
- Abnormal skull development,
altered transmission of CSF pulsations and interaction between plexiform neurofibroma and sphenoid bone are postulated as possible mechanisms.

Fig. 3
References: www.myESR.org
Frontal Radiograph of the skull.
Absence of the innominate line (arrow) Bare Orbit sign.
4.Dural tail sign :
- This sign represents thickening and enhancement of the dura mater in continuity with a Mass,
which on MR images,
gives the appearance of a tail arising from the mass.
- The dural tail is thought to represent reactive change; however,
it may also be due to tumor invasion.
- Three criteria need to be met for a 'positive' dural tail sign:The tail should be seen on two successive images through the tumor,
it should taper away from the tumor,
and it must enhance more than the tumor.
- This sign has been traditionally considered as highly specific for meningioma.
Differential diagnosis:
chloromas,
primary CNS lymphomas,
sarcoidosis,
Schwannomas,
metastases,
and syphilitic gummata.

Fig. 4
References: www.myESR.org
Coronal T1W MR shows enhancement of the dura matter in continuity with the mass.
Menigioma ( arrows)
5.Empty delta sign :
- On contrast - enhanced CT scans of the brain consists of a V-shaped or triangular pattern of enhancement surrounding a central,
relatively hypodense area.
- The sign is created by a nonenhancing thrombus in the dural sinus surrounded by triangular enhancing dura as seen on cross-section and suggests dural sinovenous thrombosis.
- The sign may not be seen in the early stage (less than 5 days) of thrombosis,
as the fresh clot is hyperdense,
or in the late stage (after more than 2 months),
as numerous channels of recanalization develop in the thrombus after 2 months.
- As yet,
no universally accepted pathophysiologic explanation for the appearance of this sign exists.
However,
numerous hypotheses include (a) recanalization of the thrombus within the sinus,
(b) organization of the clot,
(c) blood-brain barrier breakdown,
and (d) dilatation of collateral peridural and dural venous channels .
Differential diagnosis:
'pseudodelta' sign on unenhanced CT scan (hyperdense subarachnoid hemorrhage,
subdural empyema,
hematoma surrounding the sinus),
high tentorial insertion in children.

Fig. 5
References: www.myESR.org
Note the empty triangle on contrast CT on the brain ( Thrombus in the dural sinus)
6.Eye-of-the-tiger sign :
- This sign represents marked low signal intensity of the globus palladi on T2W MRI images.
This low signal surrounds a central,
small hyperintense area,
producing the eye-of-the-tiger appearance.
- The eye-of-the-tiger sign is most commonly referenced in association with Hallervorden-Spatz syndrome (HS) which is now called neurodegeneration with brain iron accumulation (NBIA) or pantothenate kinase II (PANC2)-associated neurodegeneration.
- The marked low signal intensity of the globus palladi is a result of excessive iron accumulation and the central high signal is attributed to gliosis,
increased water content,
and neuronal loss with disintegration,
vacuolization,
and cavitation of the neuropil.
Differential diagnosis:
Cortical-basal ganglionic degeneration,
early-onset levodopa-responsive parkinsonism,
and Steele-Richardson-Olszewski syndrome (progressive supranuclear palsy).

Fig. 6
References: www.myESR.org
Axial T2-WI MR shows low signal surrounding a central,
small hyperintense area,
producing the eye-of-the-tige appearance in the globus pallidus bilaterally (arrows).
7.Figure eight sign :
- Lissencephalies represent a group of disorders caused by defective neuronal migration in the period between the 8th and 14th gestational weeks,
resulting in lack of development of gyri and sulci.
- Lissencephalies are classified into complete (type I – agyria) or incomplete (type II – agyriapachygyria).
- In lissencephaly type I,
Sylvian fissures are shallow and verticalized and the brain takes a figure eight configuration because of a narrowing of its middle portion by the Sylvian fissures,
associated with the presence of colpocephaly,
flat gyri,
thickened cortex and cortico/subcortical atrophy,
characterizing Miller- Dieker syndrome .
- In lissencephaly type II,
the cortex is thickened,
with an appearance of polymicrogyria,
pachygyria,
brainstem and cerebellar hypoplasia,
hydrocephalus,characterizing Walker Warburg syndrome.

Fig. 7
References: Radiol Bras. 2011 Mar/Abr;44(2):129-133
Axial T2-weighted image of a neonate with lissencephaly demonstrating the typical figure of eight sign.
Such pattern is characterized by generalized poor development of gyri and sulci,
sylvian fissures narrowing,
in association with colpocephaly,
flat gyri,
thickened cortex and cortico/subcortical atrophy.
8.Harlequin appearance :
- It represents the elevation of the superolateral angle of the orbit along with a flat frontal bone on a plain radiograph.
- The orbit is shallow,
the lesser wing is elevated and the greater wing is expanded; on posteroanterior skull radiographs this distortion causes the superior border of the greater wing of the sphenoid to appear as a heavy dense ridge as it passes upward and outward.
- It is seen in coronal craniosynostosis,
where the anteroposterior growth of the skull is limited.
There is also relative increase in the transverse diameter of the skull,
which is called brachycephaly.
- The sign can be unilateral or bilateral,

Fig. 8
References: www.myESR.org
Skull AP radiograph shows HARLEQUIN APPEARANCE.
Schematic drawing and picture of a mask
9.High heel foot print sign :
- The high heel foot print sign is useful in the understanding of the intricate anatomy of the skull base and represent two relevant foramina.
- The anterior aspect of the high heel footprint represents the foramen ovale (FO),
and the posterior aspect (the heel itself) the foramen spinosum (FS).
- The mandibular nerve,
one of the three branches of the trigeminal nerve,
is the main FO component(1).
Also,
the otic ganglion,
the accessory meningeal artery,
the lesser petrosal nerve and the emissary veins are found in this foramen.
The middle meningeal artery is in the FS(2),
and the absence of such artery is related to the persistent stapedial artery.

Fig. 9
References: Radiol Bras. 2011 Mar/Abr;44(2):129-133
Axial CT image demonstrating normal appearance of the skull base.
The high heel foot print sign is evidenced.
The small arrow indicates the foramen spinosum,
and the large arrow,
the foramen ovale.
Anteriorly to the high heel footprint is the Vesalius foramen (venous foramen) (arrowhead).
10.Hyperdense MCA sign :
- This sign refers to the hyperdense middle cerebral artery (MCA) seen on nonenhanced CT scan images in acute stroke.
- The hyperdense MCA sign, a marker of thrombus in the MCA,
has been recognized as a harbinger of a subsequent large cerebral infarction by CT.
- Hyperdensity of the MCA is a result of acute clot formation within the artery.
- The sign is said to be seen usually within approximately 90 min of the event.
- It is suggestive of occlusion of the MCA but does not necessarily represent infarction of the brain parenchyma.

Fig. 10
References: www.myESR.org
Axial nonenhanced head CT scan shows hyperdense middle cerebral artery (MCA).
11.Hot cross bun sign :
- This sign is characterized by a cruciform pontine hyperintensity due to selective loss of neurons of the transverse pontocerebellar fibers,
with preservation of the pontine tegumentum and of the fibers of the corticospinal tract.
- Multiple systems atrophy is a neurodegenerative disorder with varying degrees of involvement of the basal ganglia and the olivopontocerebellar complex.

Fig. 11
References: Radiol Bras. 2011 Mar/Abr;44(2):129-133
Axial T2-weighted image acquired at the level of the middle cerebellar peduncles in a 59- year-old female patient with multiple systems atrophy type C.
The hot cross bun sign is characterized by cruciform pontine hyperintensity.
12.The “face of the giant panda” sign:
- The face of the giant panda pattern may be present in Wilson’s disease.
- Such disease is characterized by hepatocellular degeneration caused by a genetic disorder of the copper metabolism with its consequential accumulation in tissues,
particularly liver and brain.
- On MRI T2- weighted sequences,
one can observe hyperintensity in the pontine tegmentum,
hypointensity of the periaqueductal gray matter and partially preserved signal in the red nuclei,
in the lateral aspect of the substantia nigra pars reticulata and of the upper colliculus.

Fig. 12
References: Radiol Bras. 2011 Mar/Abr;44(2):129-133
Axial FLAIR image of a patient with Wilson’s disease.
The face of the giant panda can be seen and it is characterized by high signal intensity
in the pontine tegmentum,
hyposignal of the periaqueductal gray matter,
and preserved signal in the red nuclei,
in the lateral aspect of the pars reticulata of the substantia nigra and in the superior colliculus on T2-weighted images.
13.Ice-cream cone sign :
- The ice-cream cone sign represents the normal appearance of the malleus and incus on an axial high-resolution CT scan image of the temporal bone .
- The ball (scoop) of the ice cream is formed by the head of malleus and the cone is formed by the body of the incus.

Fig. 13
References: www.myESR.org
Axial temporal CT shows bones of middle ear.
14.Lemon sign :
- The lemon sign refers to the shape of the fetal skull at ultrasonography (US) obtained at the biparietal diameter level,
when the frontal bones lose their normal convex contour and appear flattened or inwardly scalloped.
- This gives the skull a shape similar to that of a lemon.
It can be falsely produced by angling the probe downward and anteriorly to include the orbit .
- It is classically seen as a sign of a Chiari II malformation and also seen in the majority (90-98%) of fetuses with spina bifida.

Fig. 14
References: www.myESR.org
Differential diagnosis:
- Encephalocele,
Dandy-Walker malformation with encephaloceles,
thanatophoric dysplasia,
cystic hygroma,
diaphragmatic hernia,
agenesis of the corpus callosum,
fetal hydronephrosis,
and umbilical vein varix and twovessel cord.
15.Moya moya appearance :
- Moya moya ("puff of smoke") is a term introduced by japanese investigators in 1969 to describe a telangiectatic cerebrovascular pattern in a series of Japanese children with hemiplegia.
- Moya moya appearance represents the angiographic appearance of basal telangiectasias,
which consist of dilated collateral branches of the lenticulostriate and thalamostriate arteries .
It is usually seen in the anterior circulation in association with internal carotid artery stenosis.
- When the moya moya appearance is seen along with idiopathic occlusion of the internal carotid arteries it is called moya moya disease; when the occlusion is secondary to some other disease it is called moya moya syndrome.
- Causes of moya moya syndrome include NF1,
sickle cell disease,
bacterial meningitis,
polyarteritis nodosa,
radiation therapy,
tuberculosis,
and atherosclerosis.
Children with moya moya usually have ischemia or infarction,
while adults with moya moya usually have hemorrhage.

Fig. 15
References: www.myESR.org
Moya Moya Angiographic pattern.
16.Molar tooth sign :
- The molar tooth sign is represented by an alteration of the mesencephalon which is seen on axial sections of computed tomography (CT) and magnetic resonance imaging (MRI).
- This sign is seen mainly in cases of Joubert syndrome.
- The normal superior cerebellar peduncles decussation is absent and these become thickened and with a more horizontal course as they extend perpendicularly from the brainstem.
- Joubert syndrome is an autosomal recessive disease characterized by abnormal eye movements,
nystagmus,
difficulty in following a moving object with eyes,
episodes of taquipneia and apnea besides motor developmental delay.

Fig. 16
References: Radiol Bras. 2011 Mar/Abr;44(2):129-133
Axial T1-weighted image at the level of the superior cerebellar peduncles in a patient with Joubert syndrome demonstrating molar tooth sign.
17 Medusa head sign :
- The sign is considered as a typical CT,
MR,
and angiographic appearance of venous malformations.
- It is seen in a developmental venous anomaly (DVA),
where multiple tributaries arranged in a radial fashion drain into a larger vein and this appearance resembles Medusa's (Greek) head (caput,
Latin) after her unfortunate transformation.
- This sign is best seen on gadolinium-enhanced T1 weighted images (T1WI).
- DVAs are usually located in the juxtacortical and periventricular regions and are commonly seen in the frontal and parietal lobes and in the brachium pontis

Fig. 17
References: www.myESR.org
MR shows venous malformation.
Multiple tributaries arranged in a radial fashion drain into a larger vein (arrows).
18.Pancake brain :
- This sign describes the appearance of the abnormal brain in alobar holoprosencephaly (HPE).
The appearance is caused by fusion of the cerebral hemispheres and the presence of a single ventricle in the center.
- HPE is a congenital malformation of the brain,
with variable fusion of the cerebral hemispheres,
diencephalon,
basal ganglia,
and thalami.
- In alobar HPE there is complete fusion and a monoventricle; it represents the most severe form of the malformation.
- The other two types are semilobar and lobar HPE.
- Lobar HPE is the least severe form.
- HPE is often associated with midline facial abnormalities,
and the saying ‘the face predicts the brain’ holds true for HPE.

Fig. 18
References: Indian J Radiol Imaging/May 2009/Vol 19/Issue 2
Pancake brain.
Axial T1W MRI images (A,
B) of the brain in alobar holoprosencephaly show fusion of the cerebral hemispheres,
with a single ventricular cavity (star) in the center; this gives the brain the appearance of a pancake.
Note the fusion of the thalami (arrows).
19.Radial bands sign :
- Radial bands are linear or curvilinear areas of abnormal signal intensity radiating from the periventricular region to the subcortical region on MRI images.
- These radial bands are seen in tuberous sclerosis and are best appreciated on a FLAIR sequence and on images acquired with magnetization transfer.
- It is thought that the radial bands represent abnormal migration of dysplastic stem cells along the course of the radial glial neuronal unit.
- Radial bands are hypointense to isointense on T1W images and hyperintense on T2W images in adults.
- They are hyperintense to unmyelinated white matter on T1W images and isointense to hypointense compared with white matter on T2W images in neonates and young children.
- The abnormal signal intensity is presumably due to lack of normal myelination and differences in cellular or interstitial fluid content compared to normal brain parenchyma.
Visualization of radial bands is thought to be specific to tuberous sclerosis.
- Tuberous sclerosis is a common neurocutaneous syndrome characterized by the clinical triad of epilepsy,
mental retardation,
and adenoma sebaceum.
- Other intracranial manifestations include subependymal nodules,
subependymal giant cell astrocytoma,
cortical tubers,
and white matter abnormalities.
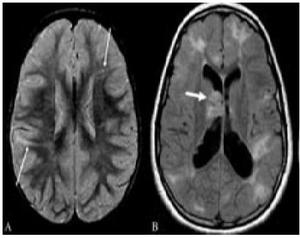
Fig. 19
References: Indian J Radiol Imaging/May 2009/Vol 19/Issue 2
Radial band sign.
Proton density-weighted axial image of the brain (A) in a patient with tuberous sclerosis shows hyperintense bands in the white matter radiating from the ventricular margin to the subcortical region (arrows).
FLAIR axial MRI image (B) shows irregular hyperintense areas in the subcortical white matter suggestive of subcortical tubers.
A large hyperintense nodule is seen in the region of the foramen of Monroe,
representing a subependymal giant cell astrocytoma (thick arrow).
20.
Reversal sign :
- This sign is seen on CT scan images and represents a diffuse decrease in the density of the cerebral hemispheres,
with loss of gray-white differentiation and a relative increase in the density of the thalami,
brainstem,
and cerebellum.
- It is also known as the‘white cerebellum sign.’
- It is seen in severe head injury,
birth asphyxia,
drowning,
status epilepticus,
bacterial meningitis,
and encephalitis.
- It represents anoxic/ischemic cerebral injury.
- It indicates irreversible brain damage and carries a poor prognosis.
- One of the proposed mechanisms for the appearance seen in the reversal sign is distension of the deep medullary veins secondary to partial obstruction of venous outflow due to raised intracranial tension.

Fig. 20
References: Indian J Radiol Imaging/May 2009/Vol 19/Issue 2
Axial noncontrast CT scan of the brain in a child with severe head injury shows low attenuation of the cerebral hemispheres with complete loss of gray matter–white matter differentiation,
small temporal horns,
and effacement of the basal cisterns.
The findings are suggestive of cerebral edema.
There is relative preservation of the cerebellum (arrows) with hyperattenuation (‘white cerebellum’).
21.Salt and pepper sign :
- This sign is seen on MRI images in paragangliomas such as glomus tumors .
- The sign is indicative of the hypervascularity of the mass.
- The 'pepper' represents multiple areas of signal void of vessels and the 'salt' represents the hyperintense foci due to slowflow vessels or hemorrhages in these hypervascular tumors.
- The sign is seen in tumors that are more than 1 cm in diameter and is not specific for paragangliomas.
- Paragangliomas can be multiple and bilateral,
especially in familial cases,
and hence evaluation of the entire neck and of both sides is needed.
- Four common locations of paragangliomas in the head and neck are the carotid body,
the jugular foramen,
along the path of the vagus nerve,
and the middle ear.
Differential diagnosis:
Metastatic hypernephroma and metastatic thyroid carcinoma (hypervascular lesions).

Fig. 21
References: www.myESR.org
Axial MRI demonstrates the salt and pepper appearance due to the hypervascularity of this right mass (paraganglioma).
22.Stripe sign/ tigroid pattern :
- This is seen as linear hypointensities radiating from the ventricular margins within hyperintense periventricular white matter and the centrum semiovale on T2W MRI images .
- The sign represents a specific pattern of demyelination,
with sparing of perivascular white matter.
- The spared perivascular white matter is seen as dark spots or dark linear areas against a background of bright affected white matter,
giving the appearance of the skin of a leopard.
- The sign is also called the ‘leopard skin sign.’ It is seen in metachromatic leukodystrophy (MLD).
- MLD is an autosomal recessive disorder with deficiency of the lysosomal enzyme arylsulfatase,
leading to accumulation of sulfatides in the brain,
peripheral nerves,
kidneys,
liver,
and gall bladder.
- Arysulfatase is required for metabolism of sulfatides,
one of the essential constituents of the myelin sheath.
- MLD can be of three types: late infantile,
juvenile,
and adult.
- Late infantile is more common and usually presents between 12 and 18 months of age.
Clinically,
children present with peripheral neuropathy and changes in intellect,
speech,
and coordination.
- The diagnosis is confirmed by finding low levels of arylsulfatase in peripheral white blood cells and urine.
- MRI shows symmetric increased signal in the periventricular white matter,
with initial sparing of the subcortical U fibers.
- No enhancement is seen in the brain tissue unlike in adrenoleukodystrophy.
- Cranial nerve enhancement has been reported recently in MLD.

Fig. 22
References: Indian J Radiol Imaging/May 2009/Vol 19/Issue 2
Axial T2W image of the brain in a child with metachromatic leukodystrophy shows symmetric,
increased signal intensity of the white matter,
with sparing of the subcortical U fibers.
Linear low signal intensity areas radiating away from the ventricular margin (arrows) represent areas of white matter around the vessels that have been spared from the process of demyelination.
These low signal linear areas within the hyperintense white matter resemble the skin of a leopard and hence the term ‘tigroid’ pattern.
FLAIR axial MRI image (B) shows symmetric hyperintensity of the white matter sparing the subcortical U fibers.
23.Tau sign :
- The tau sign represents the appearance of the presellar internal carotid artery (ICA) when a persistent trigeminal artery (PTA) originates from it,
on a T1W sagittal MRI image .
- The configuration of the flow void in the presellar segment of the ICA with the PTA arising from it,
resembles the Greek letter ‘τ’ (tau).
The sign is suggestive of a PTA.
- The PTA arises from the ICA as it exits the carotid canal and enters the cavernous sinus.
It joins the distal third of the basilar artery between the origins of the anterior,
inferior,
and superior cerebellar arteries.
A PTA can be of two types:
- The artery may supply the entire vertebrobasilar system distal to the anastomosis or
- The anastomosis may mainly supply the superior cerebellar arteries bilaterally.
- PTA can be associated with aneurysms,
arteriovenous malformations,
moya moya disease,
and other persistent carotid-vertebrobasilar anastomosis.
- Other persistent arteries that are responsible for communications between the carotid and vertebrobasilar systems are persistent hypoglossal and otic arteries.

Fig. 23
References: Indian J Radiol Imaging/May 2009/Vol 19/Issue 2
Sagittal T1-W image of the brain shows (A) flow voids of the internal carotid artery (ICA) in the precavernous segment (thick short arrow),
in the cavernous segment (medium-sized arrow),
and a persistent trigeminal artery (thin long arrow).
Together,
these flow voids form the Greek letter ‘τ’ (tau).
Sagittal view of the MRI angiogram shows the persistent trigeminal artery (arrow) arising from the ICA and joining the basilar artery in its mid segment.
24.Optic nerve tram-track sign :
- A tram-track sign is composed of two enhancing areas of tumor separated from each other by the negative defect of the optic nerve.
- It is seen on contrast-enhanced CT scan and MRI images,
in optic nerve sheath meningioma.
The sign helps distinguish between optic nerve sheath meningioma and optic glioma.
- Optic glioma arises from glial cells within the optic nerve and there is no clear separation between the nerve and the tumor; hence the tram-track sign is not seen in optic gliomas.
Calcification may be seen in optic nerve sheath meningiomas in 20–50% of cases and hence the tram-track sign may be seen on nonenhanced CT scan images as a linear calcification around the nerve,
but this is less common.
- Optic nerve meningioma is usually seen in women in the third to fifth decades of life and in children with neurofibromatosis type 2,
where it may be bilateral.
- The tram-track sign is not specific for meningiomas and has also been described in orbital pseudotumor,
perioptic neuritis,
sarcoidosis,
leukemia,
lymphomas,
metastases,
perioptic hemorrhages,
and Erdheim-Chester disease (a rare non-Langerhans cell histiocytosis).

Fig. 24
References: Indian J Radiol Imaging/May 2009/Vol 19/Issue 2
Postcontrast T1W axial MRI image of the orbits (A) shows an enhancing mass (thick small arrows) around the left optic nerve.
The optic nerve (thin long arrow) itself is not enlarged and is nonenhancing.
This is suggestive of a mass,
such as a meningioma,
arising from the optic nerve sheath.
Axial T2W MRI image of the orbits in a different patient (B) shows fusiform enlargement of the left optic nerve itself (arrows),
in a case of optic nerve glioma.
25.Hot nose sign :
- Hot nose sign represents increased perfusion in the nasopharyngeal region on radionuclide scans.
- The hot nose sign is commonly associated with brain death and serves as a secondary sign of brain death when intracerebral perfusion is absent.
- Normally,
radionuclide activity in the nasopharyngeal region is either not appreciated or seen only in the venous phase.
- Increased and early radiotracer activity in this region is seen in occlusion of one or both internal carotid arteries (ICA) from any cause,
with consequent increased flow in the external carotid artery.
- Apart from mechanical occlusion,
functional occlusion of the ICA due to elevated intracranial pressure in conditions such as cerebrovascular accident,
transient ischemic attack,
subdural hematoma,
and hepatic encephalopathy can also produce the hot nose sign.

Fig. 25
References: Indian J Radiol Imaging/May 2009/Vol 19/Issue 2
Frontal view of a radionuclide scan shows increased tracer activity in the nasopharyngeal region (arrows) suggestive of increased blood flow.
Obstruction of the internal carotid artery from any cause leads to increased flow in the external carotid artery and increased tracer activity in the nasopharyngeal region (hot nose).
26.Scalpel sign:
- The scalpel sign has been recently described in dorsal thoracic arachnoid web on sagittal MRI studies.
It relates to focal distortion of the thoracic cord,
appearing anteriorly displaced.
The enlarged dorsal CSF space mimics the profile of a surgical scalpel.
- It is helpful in distinguishing cases where the thoracic cord is focally anteriorly displaced,
a finding seen in a couple of other conditions in addition to dorsal thoracic arachnoid web,
namely ventral cord herniation and the presence of a dorsal arachnoid cyst.

Fig. 26
References: http://radiopaedia.org/
T2W Sag MR dorsal spine shows focally displaced thoracic cord anteriorly,
with widening of the dorsal CSF space.
The outline of this enlarged CSF space on sagittal imaging has been likened to the silhouette of a surgical scalpel,
and has been termed the scalpel sign.
27.En coup de sabre sign :
- Localized scleroderma is characterized by the presence of sclerotic lesions on the skin and subcutaneous tissues.
- This is different from systemic sclerosis because of the absence of significant systemic involvement; and generally presents a better prognosis.
- Localized scleroderma invariably affects the head,
presenting as a linear,
usually frontoparietal lesion (scleroderma “en coup de sabre”),
with progressive facial hemiatrophy or Parry-Romberg syndrome where the atrophy extends beyond the skin to involve the subcutaneous cellular tissue,
muscles and bones.
- Abnormal MRI findings are observed in 90% of cases and include hyperintensity on T2- weighted images of the corpus callosum,
subcortical regions,
deep gray matter and brainstem; and most of times are ipsilateral.
- Focal atrophy that is the main dermatological finding may also be observed in the cerebral parenchyma.

Fig. 27
References: Indian J Radiol Imaging/May 2009/Vol 19/Issue 2
Coronal T2-weighted image of a female patient with scleroderma “en coup de sabre” (arrow)consisting in a usually frontoparietal linear skin lesion.
B: In another female patient,
other presentation of scleroderma is the progressive facial hemiatrophy or Parry-Romberg syndrome where the atrophy extends beyond the skin and subcutaneous cellular tissue,
to involving muscles and bones
28.Empty orbit sign:
Neurofibromatosis type 1 is an autosomal dominant disease with variable presentation,
with cerebral and spinal changes seen in one third of the patients.
Among the possible alterations,
café-au-lait spots,
Lisch nodules,
plexiform fibromas and optic nerve gliomas are highlighted.
The empty orbit sign represents the appearance of the orbit on plain films of the skull and on CT scan because of the lack of the innominate line due to dysplasia of the greater wing of the sphenoid,
shortening of the lateral wall of the orbit and flattening of the orbital angle.

Fig. 28
References: Indian J Radiol Imaging/May 2009/Vol 19/Issue 2
Empty orbit sign in a 22-year-old male patient with neurofibromatosis type 1.
29.Boomerang Sign:
- Refers to boomerang shaped splenial lesion ( splenium of corpus callosum) which is seen as hyperintense lesion on T2 W/ FLAIR and DWI.
- This sign is seen in transient lesion in splenium,
diffuse axonal injury,
multiple sclerosis.

Fig. 29
References: http://radiopaedia.org/
MR reveals solitary lesion in the splenium of corpus callosum.
The lesion is hyperintense on T2/ FLAIR,
hypo intense on T1 and shows diffusion restriction.
30.
Panda sign of the mid brain:
- It is classically seen in Wilson disease,
whenever the white matter is diffusely abnormal in the region .

Fig. 30
References: http://radiopaedia.org/
The red nucleus and substantia nigra are surrounded by high T2 signal.

:129-133")


:129-133")

:129-133")

:129-133")
:129-133")


:129-133")


