This poster is published under an
open license. Please read the
disclaimer for further details.
Keywords:
Lung, Interventional non-vascular, Radiographers, MR, MR-Functional imaging, Ablation procedures, Diagnostic procedure, Education
Authors:
J. Li; Zhengzhou/CN
DOI:
10.1594/ecr2017/C-2620
Results
A total of 26 nodules in 23 patients were included in the study.
The mean patient age was 53.7 ± 13.6 years,
and 57.7% were males.
Ablation zone volume increased to 1 week after the procedure,
and then returned to baseline by 3 months.
Cavitation post-cryoablation was found in 34.6% (9/26) of the nodules 1 month after treatment.
Two types of time-signal intensity curves post-cryoablation were found: a straight line representing no definite enhancement from 1-day to 1-month,
and an inflow curve representing mild delayed enhancement from month 3 to month 12.
Local progression was associated with an incomplete hypointense rim around the ablation zone and absence of cavitation post-treatment.
Table 1 Patients characters
|
|
Patients number(nodules number)
|
|
Gender
|
|
|
male
|
12
|
|
female
|
11
|
|
Age(yr)
|
|
|
mean
|
57
|
|
range
|
25-78
|
|
Number of treated nudoles
|
|
|
1
|
20
|
|
2
|
3
|
|
3 or more
|
0
|
|
Primary lung cancer
|
11
|
|
squamous cell carcinoma
|
4
|
|
adenocarcinoma
|
7
|
|
Metastasis
|
12(15)
|
|
from HCC
|
4(6)
|
|
from lung cancer
|
2
|
|
from gastric cancer
|
3
|
|
from breast cancer
|
2(3)
|
|
from colorectal cancer
|
1
|
Table 2 Characteristic MRI findings and complicationsPostcryoablation
|
MRI findings
|
precryoablation
|
1-day postcryoablation
|
1-week
postcryoablation
|
1-month
postcryoablation
|
3-month
postcryoablation
|
6-month
postcryoablation
|
12-month postcryoablation
|
|
volume (cm3)
|
15.15 ±3.09
|
99.64 ±36.64
|
72.50 ±31.10
|
32.19 ±9.43
|
11.49 ±5.48
|
7.81 ±3.92
|
5.86 ±2.21
|
|
Postcryoablation cavitation
|
0%
|
0%
|
0%
|
34.6% (9/26)
|
11.5%(3/26)
|
0%
|
0%
|
|
mean score on T1WI
|
2.8
|
4.4
|
5.0
|
4.3
|
4.0
|
3.0
|
3.0
|
|
mean score on T2WI
|
3.9
|
4.7
|
4.8
|
4.6
|
4.0
|
3.4
|
3.1
|
|
Time-intensity
curve type
|
Vary
|
1
|
1
|
1
|
2
|
2
|
2
|
|
complications
|
|
|
|
|
|
|
|
|
consolidation
|
0%
|
42.3%(11/26)
|
26.9%(7/26)
|
7.7%(2/26)
|
0
|
0
|
0
|
|
atelectasis
|
0%
|
30.8%(8/26)
|
7.7%(2/26)
|
3.8%(1/26)
|
0
|
0
|
0
|
|
pneumothorax
|
0%
|
26.9%(7/26)
|
3.8%(1/26)
|
0%
|
0
|
0
|
0
|
In the time-intensity curve type row,
“1”represent no definite enhancement as a straight line; “2”means a mild delayed enhancement as a flow-in curve.
Table 3 Scores of two observers on T1WI and T2WI (n=26)
|
Time point
|
Scores on T1WI(%,n)
|
Scores on T2WI(%,n)
|
|
|
1
|
2
|
3
|
4
|
5
|
1
|
2
|
3
|
4
|
5
|
|
Precryoablation
|
0(0)
0(0)
|
30.8(8)
26.9(7)
|
57.6(15)
61.5(16)
|
11.6 (3)
11.6 (3)
|
0(0)
0(0)
|
0(0)
0(0)
|
0(0)
0(0)
|
34.6 (9)
26.9(7)
|
65.4(17)
73.1 (19)
|
0(0)
0(0)
|
|
|
1-daypostcryoablation
|
0(0)
0(0)
|
0(0)
0(0)
|
11.6(3)
19.2 (5)
|
61.5 (16)
61.5 (16)
|
26.9 (7)
19.2(5)
|
0(0)
0(0)
|
0(0)
0(0)
|
26.9(7)
19.2 (5)
|
73.1 (19)
80.8(21)
|
0(0)
0(0)
|
|
|
1-week postcryoablation
|
0(0)
0(0)
|
0(0)
0(0)
|
11.6(3)
11.6 (3)
|
19.2 (5)
19.2 (5)
|
69.2(18)
69.2(18)
|
0(0)
0(0)
|
0(0)
0(0)
|
11.6 (3)
11.6(3)
|
30.8 (8)
30.8(8)
|
57.6(15)
57.6(15)
|
|
|
1-month
postcryoablation
|
0(0)
0(0)
|
0(0)
0(0)
|
19.2(5)
15.4(4)
|
65.4(17)
69.2 (18)
|
15.4(4)
15.4(4)
|
0(0)
0(0)
|
0(0)
0(0)
|
80.8(21)
76.9(20)
|
19.2(5)
23.1(6)
|
0(0)
0(0)
|
|
|
3-monthpostcryoablation
|
0(0)
0(0)
|
15.4(4)
15.4(4)
|
61.5 (16)
61.5(16)
|
23.1(6)
23.1(6)
|
0(0)
0(0)
|
0(0)
0(0)
|
0(0)
0(0)
|
73.1(19)
76.9(20)
|
26.9(7)
23.1(6)
|
0(0)
0(0)
|
|
|
6-month postcryoablation
|
0(0)
0(0)
|
8.0(2)
8.0(2)
|
72.0(18)
72.0(18)
|
20.0(5)
20.0(5)
|
0(0)
0(0)
|
0(0)
0(0)
|
20.0(5)
20.0(5)
|
80.0(20)
80.0(20)
|
0(0)
0(1)
|
0(0)
0(0)
|
|
|
12monthpostcryoablation
|
0(0)
0(0)
|
9.1(2)
9.1(2)
|
90.9(20)
90.9(20)
|
0(0)
0(0)
|
0(0)
0(0)
|
0(0)
0(0)
|
9.1(2)
13.6(3)
|
90.9(20)
84.6(19)
|
0(0)
0(0)
|
0(0)
0(0)
|
|
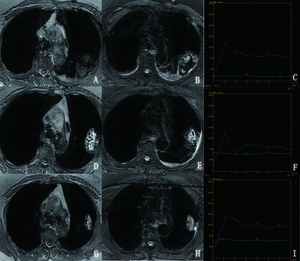
Fig. 1: figure1. the characristic findings of the ablated zone from 1 day to 1 month postcryoablation.
Fig. 1: figure1. the characristic findings of the ablated zone from 1 day to 1 month postcryoablation.
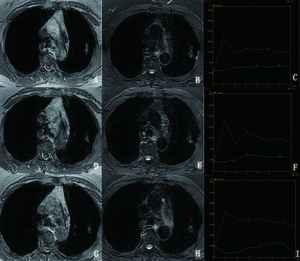
Fig. 2: figure2. the characteristic findings in the ablated zone from 3 to 12 month postcryoablation.
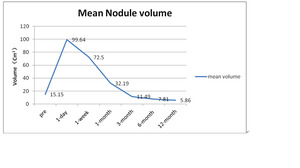
Fig. 3: figure 3. the changing character of nodule volume postcryoablation over time
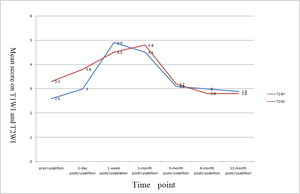
Fig. 4: figure 4. the changing character of signal intensity in the ablated zone over time
