Measurements by readers 1 and 2 for ICC-AP,
ICC-PP,
nICC-AP and nICC-PP of the gastric adenocarcinoma were 0.944,
0.991,
0.910 and 0.897,
with 95% CI 0.942–0.946,
0.899–0.993,
0.901–0.921 and 0.895–0.899,
respectively.
The maximum diameter,
IC and nIC value on the dual phase of poorly differentiated tumors were statistically greater than those of moderately differentiated ones (P<0.05).
There was significant correlation between maximum diameter and nICPP (r=0.400,
p=0.023) in cardia and fundus groups,
and in pylorus and antrum group(r=0.413,
p=0.032).
The area under the curve(AUC),
the optimal threshold,
sensitivities and specificities for discrimination for differentiation degree for ICAP were 0.687,7.45,
97.7% and 88.6%,
for ICPP were 0.692,
14.93,
95.3% and 81.8%,
for nICAP were 0.755,
0.075,
97.7% and 90.9%,
for nICPP were 0.699,
0.305,
95.3% and 93.2%.
Table 2 Correlation of quantitative spectral CT parameters with age,
gender and tumor site
|
Clinical features
|
Number of cases
|
ICAP(100µg/ml)
|
ICPP
(100µg/ml)
|
nICAP
|
nICPP
|
|
Gender
|
|
|
|
|
|
|
mail
|
60
|
12.804±4.654
|
19.902±4.904
|
0.119±0.042
|
0.412±0.061
|
|
femail
|
27
|
14.206±4.789
|
21.533±5.302
|
0.136±0.045
|
0.403±0.078
|
|
t
|
1.288
|
1.400
|
1.748
|
0.577
|
|
P
|
> 0.05
|
> 0.05
|
> 0.05
|
> 0.05
|
|
Age
|
|
|
|
|
|
|
≤55 years
|
41
|
12.915±4.005
|
19.796±4.847
|
0.128±0.047
|
0.425±0.062
|
|
>55 years
|
46
|
13.528±5.294
|
20.953±5.229
|
0.121±0.040
|
0.395±0.067
|
|
t
|
0.613
|
1.066
|
0.693
|
2.122
|
|
p-Value
|
> 0.05
|
> 0.05
|
> 0.05
|
0.037
|
|
Tumor site
|
|
|
|
|
|
|
cardia-fundus
|
32
|
13.649±5.431
|
20.621±4.952
|
0.125±0.047
|
0.418±0.066
|
|
body
|
28
|
13.206±3.589
|
19.548±4.916
|
0.131±0.036
|
0.392±0.046
|
|
pylorus-antrum
|
27
|
12.788±4.714
|
21.047±5.382
|
0.117±0.046
|
0.417±0.082
|
|
F
|
0.241
|
0.144
|
0.598
|
1.409
|
|
p-Value
|
> 0.05
|
> 0.05
|
> 0.05
|
> 0.05
|
Comparison of tumor size and quantitative spectral CT parameters betwen poorly and moderately differentiated adenocarcinomas
|
Groups
|
Maximum diameter
|
IC(100µg/ml)
|
|
nIC
|
|
ICAP
|
ICPP
|
nICAP
|
nICPP
|
|
Poorlydifferentiatedadenocarcinoma
Moderately differentiatedadenocarcinoma
|
16.065±6.405
12.168±3.104
|
14.808±5.042
11.706±3.839
|
22.133±5.475
18.722±3.997
|
|
0.144±0.047
0.105±0.029
|
0.431±0.071
0.388±0.055
|
|
t
P
|
3.624
0.000
|
3.232
0.002
|
3.312*
0.001
|
|
4.633
0.000
|
3.161*
0.002
|
Correlation of tumor maximum diameter with quantitative spectral CT parameters between different tumor sites
|
Parameters
|
fundus
|
body
|
antrum
|
|
Maximum diameter
(mm)
|
14.968 ± 6.362
|
13.517 ± 2.957
|
13.655 ± 6.005
|
|
ICAP(100µg/ml)
|
13.649 ±5.431
|
13.206 ±3.589
|
12.7884.714
|
|
ICPP(100µg/ml)
|
20.621 ±4.952
|
15.548 ±4.916
|
21.047 ±5.382
|
|
nICAP
|
0.125 ±0.047
|
0.131 ±0.036
|
0.117 ±0.046
|
|
nICPP
|
0.418 ±0.066
|
0.392 ±0.046
|
0.417 ±0.082
|
|
r diameter- ICAP
|
0.159
|
0.457
|
0.198
|
|
r diameter- ICPP
|
0.112
|
0.248
|
0.317
|
|
r diameter-nICAP
|
0.222
|
0.483
|
0.169
|
|
r diameter-nICPP
|
0.400
|
0.303
|
0.413
|
|
Pdiameter- ICAP
|
> 0.05
|
0.014
|
> 0.05
|
|
P diameter- ICPP
|
> 0.05
|
> 0.05
|
> 0.05
|
|
P diameter-nICAP
|
> 0.05
|
0.009
|
> 0.05
|
|
P diameter-nICPP
|
0.023
|
> 0.05
|
0.032
|
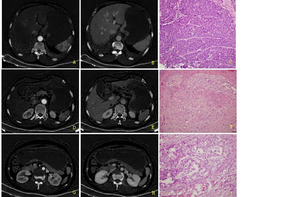
Fig. 1: Figure1.the spectral CT images and pathological features gastric adenocarcinoma with different differentiation degree and tumour loacation.
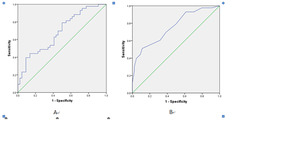
Fig. 2: Figure2. ROC curve of IC value of atrial and portal vein phase in discrimination between tumor differentiation degree of gastric adenocarcinoma.
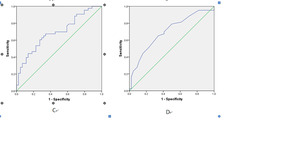
Fig. 3: Figure3. ROC curve of nIC values of atrial and portal vein phase in discrimination between tumor differentiation degree of gastric adenocarcinoma.
