Patient selection
We retrospectively reviewed all the cardiac MR examinations performed in our institution with suspicion of cardiac mass since 2012.
From them 50 had a cardiac or pericardial focal lesion.
Inclusion criteria include the presence of focal cardiac or pericardial nodule or mass and diagnostic full left ventricle coverage DWI with high b value (b= 300 s/mm2) acquired in the best plane for lesion evaluation (axial or short axis).
Patients were excluded if the MR was of poor quality,
absence of DWI acquisition,
incomplete cardiac MR protocol or contraindication for gadolinium chelate administration.
18 patients met the inclusion study criteria.
Written informed consent was obtained for all patients.
Imaging protocol
Cardiac MR imaging was performed with a 1.5 Tesla or a 3 Tesla MR,
randomly selected.
The field gradient and slew rate of the gradient subsystem equaled 30 mT/m and 120 mT/m/ms on the 1.5 Tesla magnet and 80 mT/m and 100 mT/m/ms for the 3 Tesla unit.
Dedicated cardiac surface 5 and 6 channel phased-array coils were used in both 1.5 and 3 Tesla MRI,
respectively.
Seven patients were scanned on a 3 Tesla MRI magnet (Achieva®; Phillips Healthcare; Best; Netherlands); and 11 subjects on 1.5 Tesla MRI scan (Intera®; Phillips healthcare; Best; Netherlands).
Axially oriented whole cardiac DWI Single Shot (SSh) Spin Echo (SE) Echo Plannar Imaging (EPI) was performed with prospective electrocardiogram synchronization in diastole.
The sequences were acquired in breath-hold.
Spectral Presaturation Attenuation by Inversion Recovery (SPAIR) technique was used for spectral spatial fat saturation.
Detailed parameters of the sequence acquired on 1.5 and 3 Tesla MRI are displayed in table 1 ( Fig. 1 ).
Late gadolinium enhancement (LGE) sequences with Spectral Pre-saturation with Inversion Recovery (SPIR) in short,
transverse and longitudinal long axis of the entire LV (table 1).
They were obtained after 7 to 10 minutes,
0.15 mmol/kg of Gadopentetate of dimeglumine,
(Prohance®; Bracco Diagnostics; Milan,
Italy) was infused using an 18 Gauge peripheral venous access.
Injection flow was set at 3,5 mL/second and followed by a saline flush chaser at the same velocity in a dual head power injector (Spectris Solaris EP; Medrad,
Indianola,
PA,
USA).
No adverse reactions were registered.
Dedicated short axis T1-scout sequence was systematically used for the selection of the optimal inversion recovery time.
Image analysis
All measurements and images were analyzed on dedicated advanced multimodality analysis platform (Intellispace portal version 8.0; Philips Healthcare; Best; Netherlands) using specific dedicated software (MR Cardiac Analysis; MR extended workspace 2.6.3.1; Philips Healthcare; Best; Netherlands).
Image rigid registration scheme and calculation of the ADC map including b= 0 and 300 s/mm2 gradients were done automatically.
Two readers were assigned.
The first reader had 5 years of experience reading both cardiac MRI and DWI.
The second reader had no experience reading cardiac MR but 6 years of experience reading DWI.
Both of them blindly evaluated all the examinations reading at different time T2 – STIR with LGE images and on a second time DWI with LGE sequences.
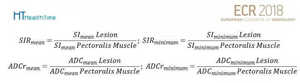
Fig. 2
Region of interest (ROI) with a minimum size of 50 mm2 were placed in the lesion and pectoralis muscle.
Mean and minimum signal intensity (SImean and SIminimum) at b=300 s/mm2 gradient and ADC (ADCmean and ADCminimum) were registered.
Patient normalization was done by obtaining mean and minimum signal intensity ratios (SIR) and ADC ratios (ADCr):
Lesions were analyzed also according to its etiology (benign/malignant) and the presence of contrast uptake in late gadolinium imaging (yes/no; homogeneous/heterogeneous).
Statistical analysis
Commercially available dedicated statistical software was used for the analysis of the recorded data (PSPP 0.8.2; GNU operating system; http://www.gnu.org/software/pspp/get.html).
Due to the small number of patients,
non-parametric tests were used.
The alpha error was set in 0.05,
so p values less than 0.05 indicate statistical significance.
Quantitative parameters were presented as median and range.
For quantitative imaging U of Mann Withney were applied.
Receiver operator curve was applied to evaluate the diagnostic performance of several quantitative variables.
For comparing polichotomic qualitative variables and quantitative ones we used Median test.
Interobserver agreement was analyzed by calculating intraclass correlation coefficient.


