ECR 2018 / C-3079
BORDER ZONE INFARCTS: imaging characteristics
Congress:
ECR 2018
Poster Number:
C-3079
Type:
Educational Exhibit
Keywords:
Neuroradiology brain, Vascular, MR, CT-Angiography, Education, Ischaemia / Infarction
Authors:
G. E. Urquieta1, G. Arango2, E. JIMENEZ3, A. Machado Heredia1; 1Santa cruz , Santa Cruz /BO, 2Bogota, Cund/CO, 3S. CRUZ/BO
DOI:
10.1594/ecr2018/C-3079

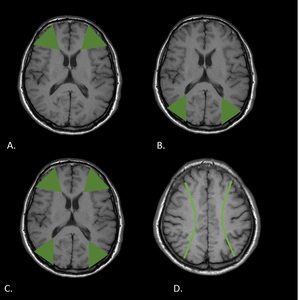
Fig. 2:
T1WI shows external border zones. A. Anterior. B. Posterior. C. Both types. D....

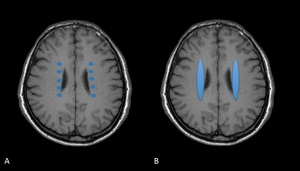
Fig. 3:
T1WI shows Internal border zones. A. Partial B. Confluent
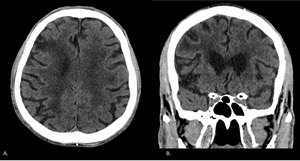
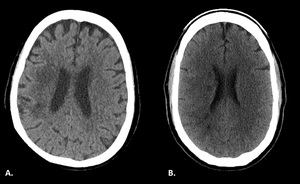
 and Coronal (B) CT plain images of a 77-year-old male show a right anterior external border zone infarct (at the junction of the right anterior and middle cerebral arteries). References: Department of Radiology, McGill University Health Center, Montreal / Canada 2017")
Fig. 4:
Axial (A) and Coronal (B) CT plain images of a 77-year-old male show a right...
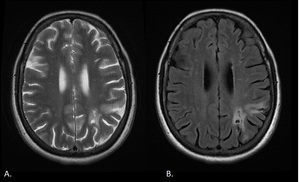
 and FLAIR (B) images obtained in a 52-year-old woman show chronic infarct in the left posterior external border zone. References: Department of Radiology, McGill University Health Center, Montreal / Canada 2017")
Fig. 5:
Axial T2 (A) and FLAIR (B) images obtained in a 52-year-old woman show chronic...
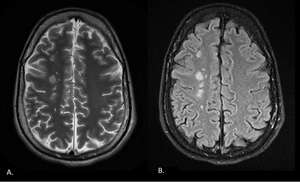
 and FLAIR (B) images obtained in a 35-year-old man show multifocal hyperintensities along the paramedian white matter. (External border zone infarct). References: Department of Radiology, McGill University Health Center, Montreal / Canada 2017")
Fig. 6:
Axial T2 (A) and FLAIR (B) images obtained in a 35-year-old man show multifocal...

Fig. 7:
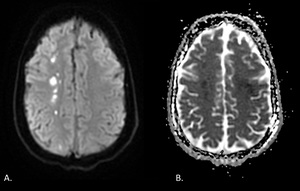
Diffusion-weighted images and ADC map obtained in a 35-year-old man show...
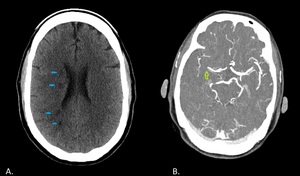
. B. CT plain of a 43-year-old male shows multiple right internal border zone infarcts (partial type). References: Department of Radiology, McGill University Health Center, Montreal / Canada 2017")
Fig. 8:
Internal border zones. A. CT plain of a 71 year-old female shows right internal...
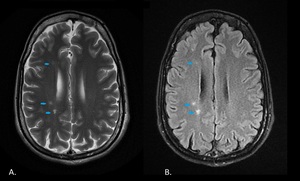
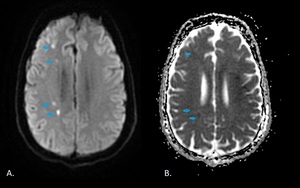
 and FLAIR (B) images obtained in a 35-year-old man show multifocal hyperintensities along the right internal border zone (blue arrows). References: Department of Radiology, McGill University Health Center, Montreal / Canada 2017")
Fig. 9:
Axial T2 (A) and FLAIR (B) images obtained in a 35-year-old man show multifocal...
. References: Department of Radiology, McGill University Health Center, Montreal / Canada 2017")
Fig. 10:
Diffusion-weighted images and ADC map obtained in a 35-year-old man show...

Fig. 11:
A. Axial plain CT obtained in a 52 year-old woman shows chronic left posterior...

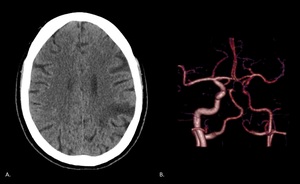
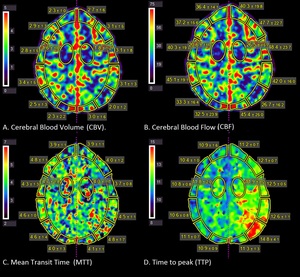
Fig. 12:
Perfusion CT maps of the same patient show reduced cerebral blood volume and...
. B. CTA MIP of the same patient shows occlusion of the distal M1 segment of the right middle cerebral artery (green arrow). References: Department of Radiology, McGill University Health Center, Montreal / Canada 2017")
Fig. 13:
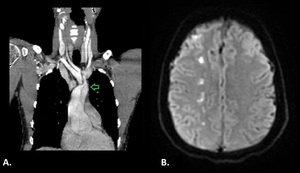
A. CT plain obtained of a 43-year-old male shows multiple right internal border...
, that seems to extend into the right brachiocephalic trunk and the origin of the left common carotid artery (arrow). B. DW MRI of the same patient shows restricted diffusion along the right paramedian white matter (External border zone infarct). References: Department of Radiology, McGill University Health Center, Montreal / Canada 2017")
Fig. 14:
A. Chest CTA obtained in a 35 year-old man shows a dissection of the aortic...